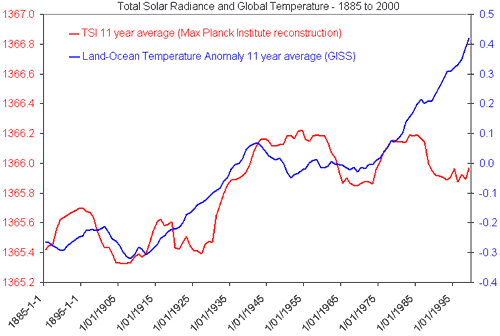
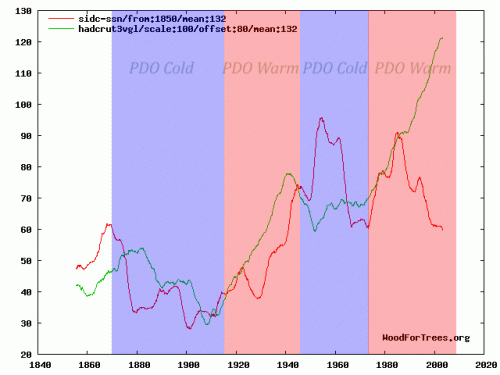
A reader wrote me a while back and asked if I could explain how I thought the sun could be a major driver of climate when temperature and solar metrics appear to have “diverged” as in the following two charts:


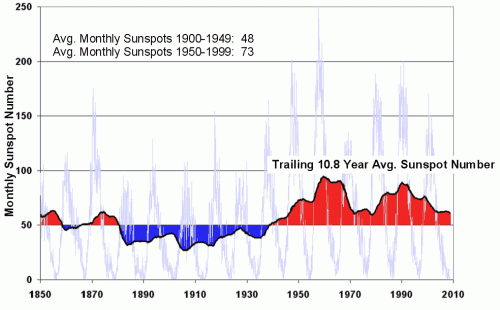
In both charts, red is the solar metric (TSI in the first chart, sunspot number in the second). The other line, either blue or green, is a global temperature metric. In both cases, we see a sort of step change in solar output, with the first half of the century at one plateau and the second half on a higher plateau. This chart of sunspot numbers may better illustrate this:

I had three answers for the reader:
- In any sufficiently chaotic and complicated system, no one variable is going to consistently regress perfectly with another variable. CO2 does not line up with temperature any better.
- There are non-solar factors at work. As I have said on any number of occasions, I agree that the greenhouse effect of CO2 exists and will add about 1C for each doubling of CO2. What I disagree with is the proposition that the Earth’s climate is dominated by positive feedback that multiplies this temperature increase 3-5 or more times. The PDO cycle is another example of a process that affects global temperatures.
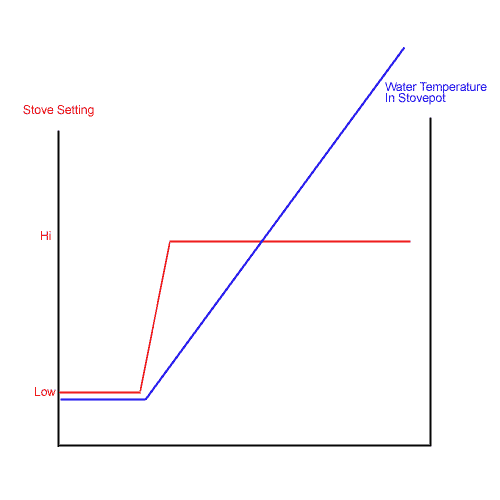
- One should not necessarily expect a linear temperature increase to be driven by a linear increase in the sun’s output. I will illustrate this with a simplistic example, and then invite further comment. I believe the following is a correct illustration of one heat source -> temperature phenomenon. If so, wouldn’t we expect something similar with step-change increases in the sun’s output, and doesn’t this chart look a lot like the charts with which I began the post?

