I am a bit late on this (I have family over for the weekend) but on the off chance you have not seen it, make sure to check out the notes from the interview of Phil Jones of the CRU. Here is the BBC Q&A. Anthony Watt has as good a summary as anyone.
Anthony summarizes as follows:
Specifically, the Q-and-As confirm what many skeptics have long suspected:
- Neither the rate nor magnitude of recent warming is exceptional.
- There was no significant warming from 1998-2009. According to the IPCC we should have seen a global temperature increase of at least 0.2°C per decade.
- The IPCC models may have overestimated the climate sensitivity for greenhouse gases, underestimated natural variability, or both.
- This also suggests that there is a systematic upward bias in the impacts estimates based on these models just from this factor alone.
- The logic behind attribution of current warming to well-mixed man-made greenhouse gases is faulty.
- The science is not settled, however unsettling that might be.
- There is a tendency in the IPCC reports to leave out inconvenient findings, especially in the part(s) most likely to be read by policy makers.
I think some of these conclusions are a bit of a reach from the Q&A. I don’t get the sense that Jones is abandoning the basic hypothesis that climate sensitivity to manmade CO2 is high (e.g. 3+ degrees per doubling, rather than <=1 degrees as many skeptics would hypothesize). In particular, I think the writing has been on the wall for a while that alarmists were bailing on the hockey stick / MWP-related arguments as indicative of high sensitivities.
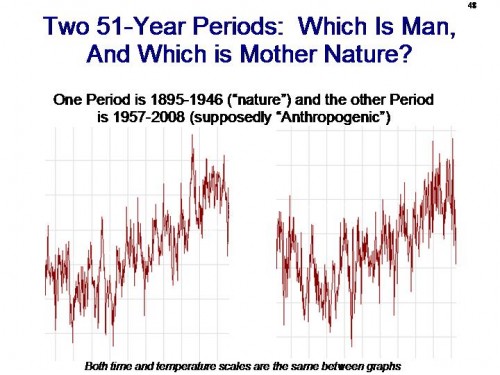
The new news for me was the admission that the warming rate from 1979-present is in no way unprecedented. This is important as the lead argument (beyond black box “the models say so” justifications) for blaming anthropogenic factors for recent warming is that the rate of warming was somehow unprecedented. However, Jones admits (as all rational skeptics have said for some time) that the warming rate from 1979 to today is really no different than we have measured in other periods decidedly unaffected by CO2.
I have made this argument before here, with the following chart:
Again, from Anthony:
Period Length Trend
(Degrees C per decade)Significance 1860-1880 21 0.163 Yes 1910-1940 31 0.15 Yes 1975-1998 24 0.166 Yes 1975-2009 35 0.161 Yes
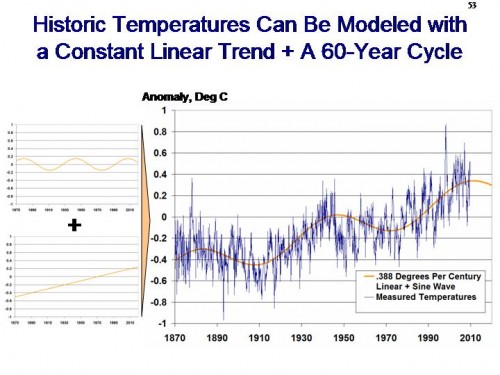
Here, by the way, was my attempt to explain the last 100 years of temperature with a cyclical wave plus a small linear trend (my much more transparent and simple climate model)
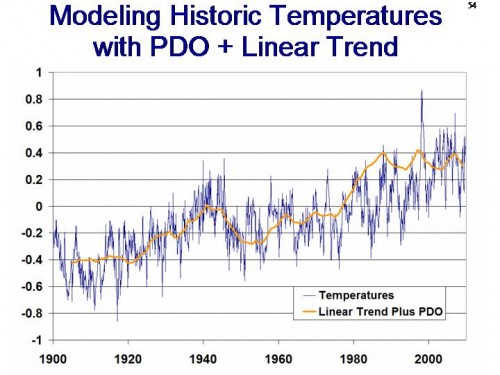
Not bad, huh? Here is a similar analysis using a linear trend plus the PDO


