Splicing data sets is a virtual necessity in climate research. Let’s think about how I might get a 500,000 year temperature record. For the first 499,000 years I probably would use a proxy such as ice core data to infer a temperature record. From 150-1000 years ago I might switch to tree ring data as a proxy. From 30-150 years ago I probably would use the surface temperature record. And over the last 30 years I might switch to the satellite temperature measurement record. That’s four data sets, with three splices.
But there is, obviously, a danger in splices. It is sometimes hard to ensure that the zero values are calibrated between two records (typically we look at some overlap time period to do this). One record may have a bias the other does not have. One record may suppress or cap extreme measurements in some way (example – there is some biological limit to tree ring growth, no matter how warm or cold or wet or dry it is). We may think one proxy record is linear when in fact it may not be linear, or may be linear over only a narrow range.
We have to be particularly careful at what conclusions we draw around the splices. In particular, one would expect scientists to be very, very skeptical of inflections or radical changes in the slope or other characteristic of the data that occur right at a splice. Occam’s Razor might suggest the more logical solution is that such changes are related to incompatibilities with the two data sets being spliced, rather than any particular change in the physical phenomena being measured.
Ah, but not so in climate. A number of the more famous recent findings in climate have coincided with splices in data sets. The most famous is in Michael Mann’s hockey stick, where the upward slope at the end of the hockey stick occurs exactly at the point where tree ring proxy data is spliced to instrument temperature measurements. In fact, if looking only at the tree ring data brought to the present, no hockey stick occurs (in fact the opposite occurs in many data sets he uses). The obvious conclusion would have been that the tree ring proxy data might be flawed, and that it was not directly comparable with instrumental temperature records. Instead, Al Gore built a movie around it. If you are interested, the splice issue with the Mann hockey stick is discussed in detail here.
Another example that I have not spent as much time with is the ocean heat content data, discussed at the end of this post. Heat content data from the ARGO buoy network is spliced onto older data. The ARGO network has shown flat to declining heat content every year of its operation, except for a jump in year one from the old data to the new data. One might come to the conclusion that the two data sets did not have their zero’s matched well, such that the one year jump is a calibration issue in joining the data sets, and not the result of an actual huge increase in ocean heat content of a magnitude that has not been observed before or since. Instead, headline read that the ARGO network has detected huge increases in ocean heat content!
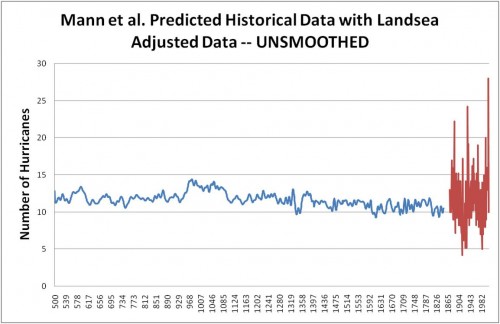
So this brings us to today’s example, probably the most stark and obvious of the bunch, and we have our friend Michael Mann to thank for that. Mr. Mann wanted to look at 1000 years of hurricanes, the way he did for temperatures. He found some proxy for hurricanes in years 100-1000, basically looking at sediment layers. He uses actual observations for the last 100 years or so as reported by a researcher named Landsea (one has to adjust hurricane numbers for observation technology bias — we don’t miss any hurricanes nowadays, but hurricanes in 1900 may have gone completely unrecorded depending on their duration and track). Lots of people argue about these adjustments, but we are not going to get into that today.
Here are his results, with the proxy data in blue and the Landsea adjusted observations in red. Again you can see the splice of two very different measurement technologies.

Now, you be the scientist. To help you analyze the data, Roger Pielke via Anthony Watt has calculated to basic statistics for the blue and red lines:
The Mann et al. historical predictions [blue] range from a minimum of 9 to a maximum of 14 storms in any given year (rounding to nearest integer), with an average of 11.6 storms and a standard deviation of 1.0 storms. The Landsea observational record [red] has a minimum of 4 storms and a maximum of 28 with and average of 11. 7 and a standard deviation of 3.75.
The two series have almost dead-on the same mean but wildly different standard deviations. So, junior climate scientists, what did you conclude? Perhaps:
- The hurricane frequency over the last 1000 years does not appear to have increased appreciably over the last 100, as shown by comparing the two means. or…
- We couldn’t conclude much from the data because there is something about our proxy that is suppressing the underlying volatility, making it difficult to draw conclusions
Well, if you came up with either of these, you lose your climate merit badge. In fact, here is one sample headline:
Atlantic hurricanes have developed more frequently during the last decade than at any point in at least 1,000 years, a new analysis of historical storm activity suggests.
Who would have thought it? A data set with a standard deviation of 3.75 produces higher maximum values than a data set with the same mean but with the standard deviation suppressed down to 1.0. Unless, of course, you actually believe that the data volatility in the underlying natural process suddenly increase several times coincidental in the exact same year as the data splice.
Mann et al.’s bottom-line results say nothing about climate or hurricanes, but what happens when you connect two time series with dramatically different statistical properties. If Michael Mann did not exist, the skeptics would have to invent him.
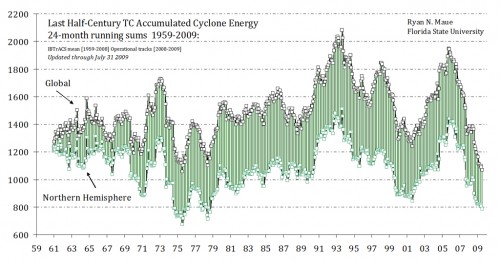
Postscript #1: By the way, hurricane counts are a horrible way to measure hurricane activity (hurricane landfalls are even worse). The size and strength and duration of hurricanes are also important. Researchers attempt to factor these all together into a measure of accumulated cyclone energy. This metric of world hurricanes and cyclones has actually be falling the last several years.
Postscript #2: Just as another note on Michael Mann, he is the guy who made the ridiculously overconfident statement that “there is a 95 to 99% certainty that 1998 was the hottest year in the last one thousand years.” By the way, Mann now denies he ever made this claim, despite the fact that he was recorded on video doing so. The movie Global Warming: Doomsday Called Off has the clip. It is about 20 seconds into the 2nd of the 5 YouTube videos at the link.

