The LA Times had a great article on correlations and causations:
AGITTARIANS are 38% more likely to break a leg than people of other star signs — and Leos are 15% more likely to suffer from internal bleeding. So says a 2006 Canadian study that looked at the reasons residents of Ontario province had unplanned stays in the hospital.
Leos, Sagittarians: There’s no need to worry. Even the study’s authors don’t believe their results.
They’re illustrating a point — that a scientific approach used in many human studies often leads to findings that are flat-out wrong.
Such studies make headlines every day, and often, as the public knows too well, they contradict each other. One week we may hear that pets are good for your health, the next week that they aren’t. One month, cellphone use causes brain cancer; the next month, it doesn’t.
“It’s the cure of the week or the killer of the week, the danger of the week,” says Dr. Barry Kramer, associate director for disease prevention at the National Institutes of Health in Bethesda, Md. It’s like treating people to an endless regimen of whiplash, he says.
Take the case of just one item: coffee. Drinking two or three cups per day can triple the risk of pancreatic cancer, according to a 1981 study. Not so, concluded a larger follow-up study published in 2001.
Coffee reduces the risk of colorectal cancer, found a 1998 study. Not so, according to one published later, in 2005.
“I’ve seen so many contradictory studies with coffee that I’ve come to ignore them all,” says Donald Berry, chair of the department of biostatistics at the University of Texas MD Anderson Cancer Center in Houston.
I wrote about some similar examples in my guide to global warming, in the chapter on the dangers of modelling based on past regression data:
How is it possible that a model that accurately represents the past fails to accurately predict the future? Financial modelers, like climate modelers, look to history in building their models. Again, like climate modelers, they rely both on theory (e.g. higher interest rates should generally mean lower stock prices) as well as observed correlations in the historic data set. The problem they meet, the problem that every modeler meets but most especially the climate modeler, is that while it is easy to use various analysis tools to find correlations in the data, there is often nothing that will tell you if there is really a causal relationship, and which way the causality runs. For example, one might observe that interest rates and exchange rates move together. Are interest rate changes leading to exchange rate adjustments, or vice versa? Or, in fact, are they both caused by a third variable? Or is their observed correlation merely coincidence?
It was once observed that if an old AFL football team wins the Superbowl, a bear market will ensue on Wall Street in the next year, while an NFL team victory presaged a bull market. As of 1997, this correlation held for 28 of the last 31 years, a far better prediction record than that of any Wall Street analyst. But of course this correlation was spurious, and in the next 4 years it was wrong every time. Had someone built a financial model on this indicator, it would have looked great when he ran it against history, but he would have lost his shirt using it.
Want a better prediction record? For seventeen straight US presidential election cycles, from 1936 to 2000, the winner of the election was accurately predicted by…the Washington Redskins. In particular, if the Redskins won their last home game before the election, the party that occupies the White House holds it in the election. Otherwise, if the Redskins lose, the opposition party wins. Seventeen in a row! R-squared of one! Success against odds of 131,072:1 of guessing all 17 right. But of course, the input was spurious, and in 2004, soon after this relationship made the rounds of the Internet, the algorithm failed.
Note that the historic relationship between football and elections is much stronger than the historic relationship between global warming and CO2. In the last 12 decades, CO2 levels and temepratures have only moved in the same direction in half the decades.
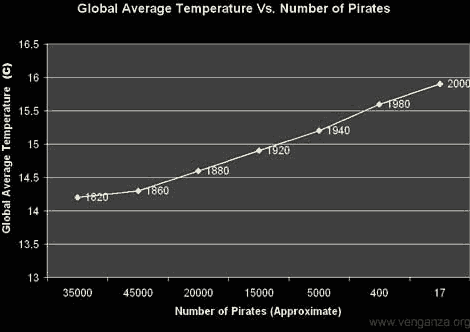
Finally, as promised in the title of this post, here is the stunning relationship between global warming and the number of pirates in the world, via the Conspiracy to Keep You Poor and Stupid:


