All posts by admin

Go Easy on the Polar Bear Fraud

The skeptic side of the blogosphere is all agog over the academic investigation into Charles Monnett, the man of drowning polar bear fame.  The speculation is that the investigation is about the original polar bear report in 2006.  A couple of thoughts

  1. If you read between the lines in the news articles, we really have no idea what is going on.  The guy could have falsified his travel expense reports
  2. The likelihood that an Obama Administration agency would be trying to root out academic fraud at all, or that if they did so they would start here, seems absurd to me.
  3. There is no room for fraud because the study was, on its face, facile and useless.  The authors basically extrapolated from a single data point.  As I tell folks all the time, if you have only one data point, you can draw virtually any trend line you want through it.  They had no evidence of what caused the bear deaths or if they were in any way typical or part of a trend — it was all pure speculation and crazy extrapolation.  How could there be fraud when there was not any data here in the first place?  The fraud was in the media, Al Gore, and ultimately the EPA treating this with any sort of gravitas.

Using Computer Models To Launder Certainty

(cross posted from Coyote Blog)

For a while, I have criticized the practice both in climate and economics of using computer models to increase our apparent certainty about natural phenomenon.   We take shaky assumptions and guesstimates of certain constants and natural variables and plug them into computer models that produce projections with triple-decimal precision.   We then treat the output with a reverence that does not match the quality of the inputs.

I have had trouble explaining this sort of knowledge laundering and finding precisely the right words to explain it.  But this week I have been presented with an excellent example from climate science, courtesy of Roger Pielke, Sr.  This is an excerpt from a recent study trying to figure out if a high climate sensitivity to CO2 can be reconciled with the lack of ocean warming over the last 10 years (bold added).

“Observations of the sea water temperature show that the upper ocean has not warmed since 2003. This is remarkable as it is expected the ocean would store that the lion’s share of the extra heat retained by the Earth due to the increased concentrations of greenhouse gases. The observation that the upper 700 meter of the world ocean have not warmed for the last eight years gives rise to two fundamental questions:

  1. What is the probability that the upper ocean does not warm for eight years as greenhouse gas concentrations continue to rise?
  2. As the heat has not been not stored in the upper ocean over the last eight years, where did it go instead?

These question cannot be answered using observations alone, as the available time series are too short and the data not accurate enough. We therefore used climate model output generated in the ESSENCE project, a collaboration of KNMI and Utrecht University that generated 17 simulations of the climate with the ECHAM5/MPI-OM model to sample the natural variability of the climate system. When compared to the available observations, the model describes the ocean temperature rise and variability well.”

Pielke goes on to deconstruct the study, but just compare the two bolded statements.  First, that there is not sufficiently extensive and accurate observational data to test a hypothesis.  BUT, then we will create a model, and this model is validated against this same observational data.  Then the model is used to draw all kinds of conclusions about the problem being studied.

This is the clearest, simplest example of certainty laundering I have ever seen.  If there is not sufficient data to draw conclusions about how a system operates, then how can there be enough data to validate a computer model which, in code, just embodies a series of hypotheses about how a system operates?

A model is no different than a hypothesis embodied in code.   If I have a hypothesis that the average width of neckties in this year’s Armani collection drives stock market prices, creating a computer program that predicts stock market prices falling as ties get thinner does nothing to increase my certainty of this hypothesis  (though it may be enough to get me media attention).  The model is merely a software implementation of my original hypothesis.  In fact, the model likely has to embody even more unproven assumptions than my hypothesis, because in addition to assuming a causal relationship, it also has to be programmed with specific values for this correlation.

This is not just a climate problem.  The White House studies on the effects of the stimulus were absolutely identical.  They had a hypothesis that government deficit spending would increase total economic activity.  After they spent the money, how did they claim success?  Did they measure changes to economic activity through observational data?  No, they had a model that was programmed with the hypothesis that government spending increased job creation, ran the model, and pulled a number out that said, surprise, the stimulus created millions of jobs (despite falling employment).  And the press reported it like it was a real number.

Postscript: I did not get into this in the original article, but the other mistake the study seems to make is to validate the model on a variable that is irrelevant to its conclusions.   In this case, the study seems to validate the model by saying it correctly simulates past upper ocean heat content numbers (you remember, the ones that are too few and too inaccurate to validate a hypothesis).  But the point of the paper seems to be to understand if what might be excess heat (if we believe the high sensitivity number for CO2) is going into the deep ocean or back into space.   But I am sure I can come up with a number of combinations of assumptions to match the historic ocean heat content numbers.  The point is finding the right one, and to do that requires validation against observations for deep ocean heat and radiation to space.

Return of “The Plug”

I want to discuss the recent Kaufman study which purports to reconcile flat temperatures over the last 10-12 years with high-sensitivity warming forecasts.  First, let me set the table for this post, and to save time (things are really busy this week in my real job) I will quote from a previous post on this topic

Nearly a decade ago, when I first started looking into climate science, I began to suspect the modelers were using what I call a “plug” variable.  I have decades of experience in market and economic modeling, and so I am all too familiar with the temptation to use one variable to “tune” a model, to make it match history more precisely by plugging in whatever number is necessary to make the model arrive at the expected answer.

When I looked at historic temperature and CO2 levels, it was impossible for me to see how they could be in any way consistent with the high climate sensitivities that were coming out of the IPCC models.  Even if all past warming were attributed to CO2  (a heroic acertion in and of itself) the temperature increases we have seen in the past imply a climate sensitivity closer to 1 rather than 3 or 5 or even 10  (I show this analysis in more depth in this video).

My skepticism was increased when several skeptics pointed out a problem that should have been obvious.  The ten or twelve IPCC climate models all had very different climate sensitivities — how, if they have different climate sensitivities, do they all nearly exactly model past temperatures?  If each embodies a correct model of the climate, and each has a different climate sensitivity, only one (at most) should replicate observed data.  But they all do.  It is like someone saying she has ten clocks all showing a different time but asserting that all are correct (or worse, as the IPCC does, claiming that the average must be the right time).

The answer to this paradox came in a 2007 study by climate modeler Jeffrey Kiehl.  To understand his findings, we need to understand a bit of background on aerosols.  Aerosols are man-made pollutants, mainly combustion products, that are thought to have the effect of cooling the Earth’s climate.

What Kiehl demonstrated was that these aerosols are likely the answer to my old question about how models with high sensitivities are able to accurately model historic temperatures.  When simulating history, scientists add aerosols to their high-sensitivity models in sufficient quantities to cool them to match historic temperatures.  Then, since such aerosols are much easier to eliminate as combustion products than is CO2, they assume these aerosols go away in the future, allowing their models to produce enormous amounts of future warming.

Specifically, when he looked at the climate models used by the IPCC, Kiehl found they all used very different assumptions for aerosol cooling and, most significantly, he found that each of these varying assumptions were exactly what was required to combine with that model’s unique sensitivity assumptions to reproduce historical temperatures.  In my terminology, aerosol cooling was the plug variable.

So now we can turn to Kaufman, summarized in this article and with full text here.  In the context of the Kiehl study discussed above, Kaufman is absolutely nothing new.

Kaufmann et al declare that aerosol cooling is “consistent with” warming from manmade greenhouse gases.

In other words, there is some value that can be assigned to aerosol cooling that offsets high temperature sensitives to rising CO2 concentrations enough to mathematically spit out temperatures sortof kindof similar to those over the last decade.  But so what?  All Kaufman did is, like every other climate modeler, find some value for aerosols that plugged temperatures to the right values.

Let’s consider an analogy.  A big Juan Uribe fan (plays 3B for the SF Giants baseball team) might argue that the 2010 Giants World Series run could largely be explained by Uribe’s performance.  They could build a model, and find out that the Giants 2010 win totals were entirely consistent with Uribe batting .650 for the season.

What’s the problem with this logic?  After all, if Uribe hit .650, he really would likely have been the main driver of the team’s success.  The problem is that we know what Uribe hit, and he batted under .250 last year.  When real facts exist, you can’t just plug in whatever numbers you want to make your argument work.

But in climate, we are not sure what exactly the cooling effect of aerosols are.  For related coal particulate emissions, scientists are so unsure of their effects they don’t even know the sign (ie are they net warming or cooling).  And even if they had a good handle on the effects of aerosol concentrations, no one agrees on the actual numbers for aerosol concentrations or production.

And for all the light and noise around Kaufman, the researchers did just about nothing to advance the ball on any of these topics.  All they did was find a number that worked, that made the models spit out the answer they wanted, and then argue in retrospect that the number was reasonable, though without any evidence.

Beyond this, their conclusions make almost no sense.  First, unlike CO2, aerosols are very short lived in the atmosphere – a matter of days rather than decades.  Because of this, they are poorly mixed, and so aerosol concentrations are spotty and generally can be found to the east (downwind) of large industrial complexes (see sample map here).

Which leads to a couple of questions.  First, if significant aerosol concentrations only cover, say, 10% of the globe, doesn’t that mean that to get a  0.5 degree cooling effect for the whole Earth, there must be a 5 degree cooling effect in the affected area.   Second, if this is so (and it seems unreasonably large), why have we never observed this cooling effect in the regions with high concentrations of manmade aerosols.  I understand the effect can be complicated by changes in cloud formation and such, but that is just further reasons we should be studying the natural phenomenon and not generating computer models to spit out arbitrary results with no basis in observational data.

Judith Currey does not find the study very convincing, and points to this study by Remer et al in 2008 that showed no change in atmospheric aerosol depths through the heart of the period of supposed increases in aerosol cooling.
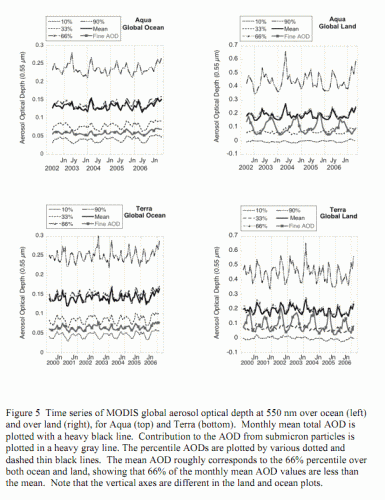
So the whole basis for the study is flawed – its based on the affect of increasing aerosol concentrations that actually are not increasing.  Just because China is producing more does not apparently mean there is more in the atmosphere – it may be reductions in other areas like the US and Europe are offsetting Chinese emissions or that nature has mechanisms for absorbing and eliminating the increased emissions.

By the way, here was Curry’s response, in part:

This paper points out that global coal consumption (primarily from China) has increased significantly, although the dataset referred to shows an increase only since 2004-2007 (the period 1985-2003 was pretty stable).  The authors argue that the sulfates associated with this coal consumption have been sufficient to counter the greenhouse gas warming during the period 1998-2008, which is similar to the mechanism that has been invoked  to explain the cooling during the period 1940-1970.

I don’t find this explanation to be convincing because the increase in sulfates occurs only since 2004 (the solar signal is too small to make much difference).  Further, translating regional sulfate emission into global forcing isnt really appropriate, since atmospheric sulfate has too short of an atmospheric lifetime (owing to cloud and rain processes) to influence the global radiation balance.

Curry offers the alternative explanation of natural variability offsetting Co2 warming, which I think is partly true.  Though Occam’s Razor has to force folks at some point to finally question whether high (3+) temperature sensitivities to CO2 make any sense.  Seriously, isn’t all this work on aerosols roughly equivalent to trying to plug in yet more epicycles to make the Ptolemaic model of the universe continue to work?

Postscript: I will agree that there is one very important affect of the ramp-up of Chinese coal-burning that began around 2004 — the melting of Arctic Ice.  I strongly believe that the increased summer melts of Arctic ice are in part a result of black carbon from Asia coal burning landing on the ice and reducing its albedo (and greatly accelerating melt rates).   Look here when Arctic sea ice extent really dropped off, it was after 2003.    Northern Polar temperatures have been fairly stable in the 2000’s (the real run-up happened in the 1990’s).   The delays could be just inertia in the ocean heating system, but Arctic ice melting sure seems to correlate better with black carbon from China than it does with temperature.

I don’t think there is anything we could do with a bigger bang for the buck than to reduce particulate emissions from Asian coal.  This is FAR easier than CO2 emissions reductions — its something we have done in the US for nearly 40 years.

Just 20 Years

I wanted to pull out one thought from my longer video and presentation on global warming.

As a reminder, I adhere to what I call the weak anthropogenic theory of global warming — that the Earth’s sensitivity to CO2, net of all feedback effects, is 1C per doubling of CO2 concentrations or less, and that while man may therefore be contributing to global warming with his CO2 (not to mention his land use and other practices) the net effect falls far short of catastrophic.

While in the media, alarmists want to imply that the their conclusions about climate sensitivity are based on a century of observation, but this is not entirely true.  Certainly we have over a century of temperature measurements, but only a small part of this history is consistent with the strong anthropogenic theory.  In fact, I observed in my video is that the entire IPCC case for a high climate sensitivity to CO2 is based on just 20 years of history, from about 1978 to 1998.

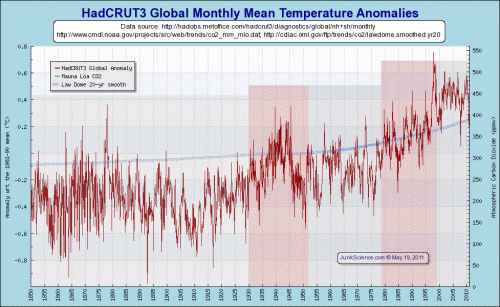
Here are the global temperatures in the Hadley CRUT3 data base, which is the primary data from which the IPCC worked (hat tip Junk Science Global Warming at a Glance)  click to enlarge

Everything depends on how one counts it, but during the period of man-made CO2 creation, there are really just two warming periods, if we consider the time from 1910 to 1930 just a return to the mean.

  • 1930-1952, where temperatures spiked about a half a degree and ended 0.2-0.3 higher than the past trend
  • 1978-1998, where temperatures rose about a half a degree, and have remained at that level since

Given that man-made CO2 output did not really begin in earnest until after 1950 (see the blue curve of atmospheric CO2 levels on the chart), even few alarmists will attribute the runup in temperatures from 1930-1952 (a period of time including the 1930’s Dust Bowl) to anthropogenic CO2.  This means that the only real upward change in temperatures that could potentially be blamed on man-made CO2 occurred from 1978-1998.

This is a very limited amount of time to make sweeping statements about climate change causation, particularly given the still infant-level knowledge of climate science.  As a result, since 1970, skeptics and alarmists have roughly equal periods of time where they can make their point about temperature causation (e.g. 20 years of rising CO2 and flat temperatures vs. 20 years of rising CO2 and rising temperatures).

This means that in the last 40 years, both skeptics and alarmists must depend on other climate drivers to make their case  (e.g. skeptics must point to other natural factors for the run-up in 1978-1998, while alarmists must find natural effects that offset or delayed warming in the decade either side of this period).  To some extent, this situation slightly favors skeptics, as skeptics have always been open to natural effects driving climate while alarmists have consistently tried to downplay natural forcing changes.

I won’t repeat all the charts, but starting around chart 48 of this powerpoint deck (also in the video linked above) I present some alternate factors what may have contributed, along with greenhouse gases, to the 1978-1998 warming (including two of the strongest solar cycles of the century and a PDO warm period nearly exactly matching these two decades).

Postscript: Even if the entire 0.7C or so temperature increase in the whole of the 20th century is attributed to manmade CO2, this still implies a climate sensitivity FAR below what the IPCC and other alarmists use in their models.   Given about 44% of a doubling since the industrial revolution began in CO2 concentrations, this would translate into a temperature sensitivity of 1.3C  (not a linear extrapolation, the relationship is logarithmic).

This is why alarmists must argue that not only has all the warming we have seen been due to CO2 ( heroic assumption in and of itself) but that there are additional effects masking or hiding the true magnitude of past warming.  Without these twin, largely unproven assumptions, current IPCC “consensus” numbers for climate sensitivity would be absurdly high.  Again, I address this in more depth in my video.

Climate Models

My article this week at Forbes.com digs into some fundamental flaws of climate models

When I looked at historic temperature and CO2 levels, it was impossible for me to see how they could be in any way consistent with the high climate sensitivities that were coming out of the IPCC models.  Even if all past warming were attributed to CO2  (a heroic acertion in and of itself) the temperature increases we have seen in the past imply a climate sensitivity closer to 1 rather than 3 or 5 or even 10  (I show this analysis in more depth in this video).

My skepticism was increased when several skeptics pointed out a problem that should have been obvious.  The ten or twelve IPCC climate models all had very different climate sensitivities — how, if they have different climate sensitivities, do they all nearly exactly model past temperatures?  If each embodies a correct model of the climate, and each has a different climate sensitivity, only one (at most) should replicate observed data.  But they all do.  It is like someone saying she has ten clocks all showing a different time but asserting that all are correct (or worse, as the IPCC does, claiming that the average must be the right time).

The answer to this paradox came in a 2007 study by climate modeler Jeffrey Kiehl.  To understand his findings, we need to understand a bit of background on aerosols.  Aerosols are man-made pollutants, mainly combustion products, that are thought to have the effect of cooling the Earth’s climate.

What Kiehl demonstrated was that these aerosols are likely the answer to my old question about how models with high sensitivities are able to accurately model historic temperatures.  When simulating history, scientists add aerosols to their high-sensitivity models in sufficient quantities to cool them to match historic temperatures.  Then, since such aerosols are much easier to eliminate as combustion products than is CO2, they assume these aerosols go away in the future, allowing their models to produce enormous amounts of future warming.

Specifically, when he looked at the climate models used by the IPCC, Kiehl found they all used very different assumptions for aerosol cooling and, most significantly, he found that each of these varying assumptions were exactly what was required to combine with that model’s unique sensitivity assumptions to reproduce historical temperatures.  In my terminology, aerosol cooling was the plug variable.

Global Warming Will Substantially Change All Weather — Except Wind, Which Stays the Same

This is a pretty funny point noticed by Marlo Lewis at globalwarming.org.  Global warming will apparently cause more rain, more drought, more tornadoes, more hurricanes, more extreme hot weather, more extreme cold weather, more snow, and less snow.

Fortunately, the only thing it apparently does not change is wind, and leaves winds everywhere at least as strong as they are now.

Rising global temperatures will not significantly affect wind energy production in the United States concludes a new study published this week in the Proceedings of the National Academy of Sciences Early Edition.

But warmer temperatures could make wind energy somewhat more plentiful say two Indiana University (IU) Bloomington scientists funded by the National Science Foundation (NSF).

. . .

They found warmer atmospheric temperatures will do little to reduce the amount of available wind or wind consistency–essentially wind speeds for each hour of the day–in major wind corridors that principally could be used to produce wind energy.

. . .

“The models tested show that current wind patterns across the US are not expected to change significantly over the next 50 years since the predicted climate variability in this time period is still within the historical envelope of climate variability,” said Antoinette WinklerPrins, a Geography and Spatial Sciences Program director at NSF.

“The impact on future wind energy production is positive as current wind patterns are expected to stay as they are. This means that wind energy production can continue to occur in places that are currently being targeted for that production.”

Even though global warming will supposedly shift wet and dry areas, it will not shift windy areas and so therefore we should all have a green light to continue to pour taxpayer money into possibly the single dumbest source of energy we could consider.

Using Models to Create Historical Data

Megan McArdle points to this story about trying to create infant mortality data out of thin air:

Of the 193 countries covered in the study, the researchers were able to use actual, reported data for only 33. To produce the estimates for the other 160 countries, and to project the figures backwards to 1995, the researchers created a sophisticated statistical model. [1]What’s wrong with a model? Well, 1) the credibility of the numbers that emerge from these models must depend on the quality of “real” (that is, actual measured or reported) data, as well as how well these data can be extrapolated to the “modeled” setting ( e.g. it would be bad if the real data is primarily from rich countries, and it is “modeled” for the vastly different poor countries – oops, wait, that’s exactly the situation in this and most other “modeling” exercises) and 2) the number of people who actually understand these statistical techniques well enough to judge whether a certain model has produced a good estimate or a bunch of garbage is very, very small.

Without enough usable data on stillbirths, the researchers look for indicators with a close logical and causal relationship with stillbirths. In this case they chose neonatal mortality as the main predictive indicator. Uh oh. The numbers for neonatal mortality are also based on a model (where the main predictor is mortality of children under the age of 5) rather than actual data.

So that makes the stillbirth estimates numbers based on a model…which is in turn…based on a model.

This sound familiar to anyone?   The only reason it is not a good analog to climate is that the article did not say that they used mortality data from 1200 kilometers away to estimate a country’s historic numbers.

Smart, numerically facile people who glibly say they support the science of anthropogenic global warming would be appalled if they actually looked at it in any depth.   While gender studies grads and journalism majors seem consistently impressed with the IPCC, physicists, economics, geologists, and others more used to a level of statistical rigor generally turn from believers to skeptics once they dig into the details.  I did.

We Are Finally Seeing Healthy Perspectives on CO2 in the Media

The media loves lurid debates.  Which in the climate debate has meant that to the extent skeptics even get mentioned or quoted in media articles, it is often in silly, non-scientific sound bites.  Which is why I liked this editorial in the Financial Post, which is a good presentation of the typical science-based skeptic position – certainly it is close to the one I outlined in this video.  An excerpt:

Let’s be perfectly clear. Carbon dioxide is a greenhouse gas, and other things being equal, the more carbon dioxide in the air, the warmer the planet. Every bit of carbon dioxide that we emit warms the planet. But the issue is not whether carbon dioxide warms the planet, but how much.

Most scientists, on both sides, also agree on how much a given increase in the level of carbon dioxide raises the planet’s temperature, if just the extra carbon dioxide is considered. These calculations come from laboratory experiments; the basic physics have been well known for a century.

The disagreement comes about what happens next.

The planet reacts to that extra carbon dioxide, which changes everything. Most critically, the extra warmth causes more water to evaporate from the oceans. But does the water hang around and increase the height of moist air in the atmosphere, or does it simply create more clouds and rain? Back in 1980, when the carbon dioxide theory started, no one knew. The alarmists guessed that it would increase the height of moist air around the planet, which would warm the planet even further, because the moist air is also a greenhouse gas.

This is the core idea of every official climate model: For each bit of warming due to carbon dioxide, they claim it ends up causing three bits of warming due to the extra moist air. The climate models amplify the carbon dioxide warming by a factor of three — so two-thirds of their projected warming is due to extra moist air (and other factors); only one-third is due to extra carbon dioxide.

That’s the core of the issue. All the disagreements and misunderstandings spring from this. The alarmist case is based on this guess about moisture in the atmosphere, and there is simply no evidence for the amplification that is at the core of their alarmism.

That is just amazingly close to what I wrote in a Forbes column a few months back:

It is important to begin by emphasizing that few skeptics doubt or deny that carbon dioxide (CO2) is a greenhouse gas or that it and other greenhouse gasses (water vapor being the most important) help to warm the surface of the Earth. Further, few skeptics deny that man is probably contributing to higher CO2 levels through his burning of fossil fuels, though remember we are talking about a maximum total change in atmospheric CO2 concentration due to man of about 0.01% over the last 100 years.

What skeptics deny is the catastrophe, the notion that man’s incremental contributions to CO2 levels will create catastrophic warming and wildly adverse climate changes. To understand the skeptic’s position requires understanding something about the alarmists’ case that is seldom discussed in the press: the theory of catastrophic man-made global warming is actually comprised of two separate, linked theories, of which only the first is frequently discussed in the media.

The first theory is that a doubling of atmospheric CO2 levels (approximately what we might see under the more extreme emission assumptions for the next century) will lead to about a degree Celsius of warming. Though some quibble over the number – it might be a half degree, it might be a degree and a half – most skeptics, alarmists and even the UN’s IPCC are roughly in agreement on this fact.

But one degree due to the all the CO2 emissions we might see over the next century is hardly a catastrophe. The catastrophe, then, comes from the second theory, that the climate is dominated by positive feedbacks (basically acceleration factors) that multiply the warming from CO2 many fold. Thus one degree of warming from the greenhouse gas effect of CO2 might be multiplied to five or eight or even more degrees.

This second theory is the source of most of the predicted warming – not greenhouse gas theory per se but the notion that the Earth’s climate (unlike nearly every other natural system) is dominated by positive feedbacks. This is the main proposition that skeptics doubt, and it is by far the weakest part of the alarmist case. One can argue whether the one degree of warming from CO2 is “settled science” (I think that is a crazy term to apply to any science this young), but the three, five, eight degrees from feedback are not at all settled. In fact, they are not even very well supported.

Losing Sight of the Goal

Like many, I have been astonished by the breaches of good scientific practice uncovered by the Climategate emails.  But to my mind, the end goal here is not to punish those involved but to

  • Enforce good data and code archiving practices.  Our goal should be that no FOIA is necessary to get the information needed to replicate a published study
  • Create an openness to scrutiny and replication which human nature resists, but generally exists in most non-climate sciences.

I worry that over the last few months, with the Virginia FOIA inquiry and the recent investigations of Michael Mann, skeptic’s focus has shifted to trying to take out their frustration with and disdain for Michael Mann in the form of getting him rung up on charges.   I fear the urge to mount Mann’s head in their trophy case is distracting folks from what the real goals here should be.

I know those in academia like to pretend they are not, but professors at state schools or who are doing research with government money are just as much government employees as anyone in the DMV or post office.  And as such, their attempts to evade scrutiny or hide information irritate the hell out of me.  But I would happily give the whole Jones/Mann/Briffa et all Climategate gang a blanket pardon in exchange for some better ground rules in climate science going forward.

Skeptics are rightly frustrated with the politicization of science and the awful personal attacks skeptics get when alarmists try to avoid debate on the science.  But the correct response here is to take the high ground, NOT to up the stakes in the politicization game by bringing academics we think to be incorrect up on charges.  I am warning all of you, this is a bad, bad precedent.

Postscript: I now your response already — there are good and valid legal reasons for charging Mann, here are the statutes he broke, etc.  I don’t disagree.  But here is my point — the precedent we set here will not be remembered as an academic brought down for malfeasance.  It will be remembered as an academic brought down by folks who disagreed with his scientific findings.  You may think that unfair, but that is the way the media works.  The media is not on the skeptic side, and even if it were neutral, it is always biased to the more sensational story line.

New Roundup

For a variety of reasons I have been limited in blogging, but here is a brief roundup of interesting stories related to the science of anthropogenic global warming.

  • Even by the EPA’s own alarmist numbers, a reduction in man-made warming of 0.01C in the year 2100 would cost $78 billion per year.  This is over $7 trillion a year per degree of avoided warming, again using even the EPA’s overly high climate sensitivity numbers.   For scale, this is almost half the entire US GDP.   This is why the precautionary principle was always BS – it assumed that the cost of action was virtually free.  Sure it makes sense to avoid low-likelihood but high-cost future contingencies if the cost of doing so is low.  But half of GDP?
  • As I have written a zillion times, most of the projected warming from CO2 is not from CO2 directly but from positive feedback effects hypothesized in the climate.  The largest of these is water vapor.  Water is (unlike CO2) a strong greenhouse gas and if small amounts of warming increase water vapor in the atmosphere, that would be a positive feedback effect that would amplify warming.   Most climate modellers assume relative humidity stays roughly flat as the world warms, meaning total water vapor content in the atmosphere will rise.  In fact, this does not appear to have been the case over the last 50 years, as relative humidity has fallen while temperatures have risen.  Further, in a peer-reviewed article, scientists suggest certain negative feedbacks that would tend to reduce atmospheric water vapor.
  • A new paper reduces the no-feedback climate sensitivity to CO2 from about 1-1.2C/doubling (which I and most other folks have been using) to something like 0.41C.  This is the direct sensitivity to CO2 before feedbacks, if I understand the paper correctly. without any reference to feedbacks.  In that sense, the paper seems to be wrong in comparing this sensitivity to the IPCC numbers, which are including feedbacks.  A more correct comparison is of the 0.41C to a number about 1.2C, which is what I think the IPCC is using.   Never-the-less, if correct, halving this sensitivity number should halve the post-feedback number.

My hypothesis continues to be that the post feedback climate sensitivity to CO2 number, expressed as degrees C per doubling of atmospheric CO2 concentrations, is greater than zero and less than one.

  • It is pretty much time to stick a fork in the hide-the-decline debate.  This is yet another occasion when folks (in this case Mann, Briffa, Jones) should have said “yep, we screwed up” years ago and moved on.  Here is the whole problem in 2 charts.  Steve McIntyre recently traced the hide-the-decline trick (which can be summarized as truncating/hiding/obfuscating data that undermined their hypothesis on key charts) back to an earlier era.

Extreme Events

My modelling backing began in complex dynamics (e.g. turbulent flows) but most of my experience is in financial modelling.  And I can say with a high degree of confidence that anyone in the financial world who actually bet money based on this modelling approach (employed in the recent Nature article on UK flooding) can be described with one word: bankrupt.  No one in their right mind would have any confidence in this approach.  No one would ever trust a model that has been hand-tuned to match retrospective data to be accurate going forward, unless that model had been observed to have a high degree of accuracy when actually run forward for a while (a test every climate model so far fails).  And certainly no one would trust a model based on pure modelling without even reference to historical data.

Te entire emerging industry of pundits willing to ascribe individual outlier weather events to manmade CO2 simply drive me crazy.  Forget the uncertainties with catastrophic anthropogenic global warming theory.  Consider the following:

  • I can think of no extreme weather event over the last 10 years that has been attributed to manmade CO2 (Katrina, recent flooding, snowstroms, etc) for which there are not numerous analogs in pre-anthropogenic years.   The logic that some event is unprecedented and therefore must be manmade is particularly absurd when the events in question are not unprecedented.  In some sense, the purveyors of these opinions are relying on really short memories or poor Google skills in their audiences.
  • Imagine weather simplified to 200 balls in a bingo hopper.  195 are green and 5 are red.  At any one point in time, the chance is 2.5% that a red ball (an extreme event) is pulled.  Now add one more ball.  The chances of an extreme even is now 20% higher.  At some point a red ball is pulled.  Can you blame the manual addition of a red ball for that extreme event?  How?  A red ball was going to get pulled anyway, at some point, so we don’t know if this was one of the originals or the new one.  In fact, there is only a one in six chance this extreme event is from our manual intervention.   So even if there is absolute proof the probability of extreme events has gone up, it is still impossible to ascribe any particular one to that increased probability.
  • How many samples would one have to take to convince yourself, with a high probability, the distribution has gone up?  The answer is … a lot more than just having pulled one red ball, which is basically what has happened with reporting on extreme events.  In fact, the number is really, really high because in the real climate we don’t even know the starting distribution with any certainty, and at any point in time other natural effects are adding and subtracting green and red balls (not to mention a nearly infinite number of other colors).

Duty to Disclose

When prosecutors put together their case at trial (at least in the US) they have a legal duty to share all evidence, including potentially exculpatory evidence, with the defense.  When you sell your house or take a company public, there is a legal requirement to reveal major known problems to potential buyers.  Of course, there are strong incentives not to share this information, but when people fail on this it is considered by all to be fraud.

I would have thought the same standard exists in scientific research, ie one has an ethical obligation to reveal data or experiments that do not confirm one’s underlying hypothesis or may potentially cast some doubt on the results.  After all, we are after truth, right?

Two posts this week shed some interesting light on this issue  vis a vis dendro-climatology.  I hesitate to pile on much on the tree ring studies at this point, as they have about as much integrity right now as the study of alchemy.  If we are going to get some real knowledge out of this data, someone is going to have to tear the entire field down to bedrock and start over (as was eventually done when alchemy became chemistry).  But I do think both of these posts raise useful issues that go beyond just Mann, Briffa, and tree rings.

In the first, Steve McIntyre looks at one of the Climategate emails from Raymond Bradley where Bradley is almost proudly declaring that MBH98 had purposely withheld data that would have made their results look far less certain.  He taunts skeptics for not yet figuring out the game, an ethical position roughly equivalent to Bernie Madoff taunting investors for being too dumb to figure out he was duping them with a Ponzi scheme.

In the second, Judith Curry takes a look at the Briffa “hide the decline” trick.  There is a lot of confusion about just what this trick was.  In short, the expected behavior of tree ring results in the late 20th century diverged from actual measured temperatures.  In short, the tree rings showed temperatures falling since about 1950 when they have in fact risen.   Since there is substantial disagreement on whether tree rings really do act as reliable proxies for temperatures, this is an important fact since if tree rings are failing to follow temperatures for the last half century, there could easily be similar failures in the past.  Briffa and the IPCC removed the post-1950 tree ring data from key charts presented to the public, and used the graphical trick of overlaying gauge temperature records to imply that the proxies continued to go up.

Given the heat around this topic, Curry tries to step back and look at the issue dispassionately.  Unlike many, she does not assign motivations to people when these are not known, but she does conclude:

There is no question that the diagrams and accompanying text in the IPCC TAR, AR4 and WMO 1999 are misleading.  I was misled.  Upon considering the material presented in these reports, it did not occur to me that recent paleo data was not consistent with the historical record.  The one statement in AR4 (put in after McIntyre’s insistence as a reviewer) that mentions the divergence problem is weak tea.

It is obvious that there has been deletion of adverse data in figures shown IPCC AR3 and AR4, and the 1999 WMO document.  Not only is this misleading, but it is dishonest (I agree with Muller on this one).  The authors defend themselves by stating that there has been no attempt to hide the divergence problem in the literature, and that the relevant paper was referenced.  I infer then that there is something in the IPCC process or the authors’ interpretation of the IPCC process  (i.e. don’t dilute the message) that corrupted the scientists into deleting the adverse data in these diagrams.

The best analogy I can find for this behavior is prosecutorial abuse.  When prosecutors commit abuses (e.g. failure to share exculpatory evidence), it is often because they are just sure the defendent is guilty.  They can convince themselves that even though they are breaking the law, they are serving the law in a larger sense because they are making sure guilty people go to jail.  Of course, this is exactly how innocent people rot in jail for years, because prosecutors are not supposed to be the ultimate aribiter of guilt and innosence.  In the same way, I am sure Briffa et al felt that by cutting ethical corners, they were serving a larger purpose because they were just sure they were right.  Excupatory evidence might just confuse the jury and lead, in their mind, to a miscarriage of justice.   As Michael Mann wrote (as quoted by Curry)

Otherwise, the skeptics have an field day casting doubt on our ability to understand the factors that influence these estimates and, thus, can undermine faith in the paleoestimates. I don’t think that doubt is scientifically justified, and I’d hate to be the one to have to give it fodder!

A Good Idea

This strikes me as an excellent idea — there are a lot of things in climate that will remain really hard to figure out, but a scientifically and statistically sound approach to creating a surface temperature record should not be among them.  It is great to see folks moving beyond pointing out the oft-repeated flaws in current surface records (e.g. from NOAA, GISS, and the Hadley Center) and deciding to apply our knowledge of those flaws to creating a better record.   Bravo.

Warming in the historic record is not going away.  It may be different by a few tenths, but I am not sure its going to change arguments one way or another.  Even the (what skeptics consider) exaggerated current global temperature metrics fall far short of the historic warming that would be consistent with current catastrophic high-CO2-sensitivity models.  So a few tenths higher or lower will not change this – heroic assumptions of tipping points and cooling aerosols will still be needed either way to reconcile aggressive warming forecasts with history.

What can be changed, however, is the stupid amount of time we spend arguing about a topic that should be fixable.  It is great to see a group trying to honestly create such a fix so we can move on to more compelling topics.  Some of the problems, though, are hard to fix — for example, there simply has been a huge decrease in the last 20 years of stations without urban biases, and it will be interesting to see how the team works around this.

My Favorite Topic, Feedback

I have posted on this a zillion times over here, and most of you are up to speed on this, but I posted this for my Coyote Blog readers and thought it would be good to repost over here.

Take all the psuedo-quasi-scientific stuff you read in the media about global warming.  Of all that mess, it turns out there is really only one scientific question that really matters on the topic of man-made global warming: Feedback.

While the climate models are complex, and the actual climate even, err, complexer, we can shortcut the reaction of global temperatures to CO2 to a single figure called climate sensitivity.  How many degrees of warming should the world expect for each doubling of CO2 concentrations  (the relationship is logarithmic, so that is why sensitivity is based on doublings, rather than absolute increases — an increase of CO2 from 280 to 290 ppm should have a higher impact on temperatures than the increase from, say, 380 to 390 ppm).

The IPCC reached a climate sensitivity to CO2 of about 3C per doubling.  More popular (at least in the media) catastrophic forecasts range from 5C on up to about any number you can imagine, way past any range one might consider reasonable.

But here is the key fact — Most folks, including the IPCC, believe the warming sensitivity from CO2 alone (before feedbacks) is around 1C or a bit higher (arch-alarmist Michael Mann did the research the IPCC relied on for this figure).  All the rest of the sensitivity between this 1C and 3C or 5C or whatever the forecast is comes from feedbacks (e.g. hotter weather melts ice, which causes less sunlight to be reflected, which warms the world more).  Feedbacks, by the way can be negative as well, acting to reduce the warming effect.  In fact, most feedbacks in our physical world are negative, but alarmist climate scientists tend to assume very high positive feedbacks.

What this means is that 70-80% or more of the warming in catastrophic warming forecasts comes from feedback, not CO2 acting alone.   If it turns out that feedbacks are not wildly positive, or even are negative, then the climate sensitivity is 1C or less, and we likely will see little warming over the next century due to man.

This means that the only really important question in the manmade global warming debate is the sign and magnitude of feedbacks.  And how much of this have you seen in the media?  About zero?  Nearly 100% of what you see in the media is not only so much bullshit (like whether global warming is causing the cold weather this year) but it is also irrelevant.  Entirely tangential to the core question.  Its all so much magician handwaving trying to hide what is going on, or in this case not going on, with the other hand.

To this end, Dr. Roy Spencer has a nice update.  Parts are a bit dense, but the first half explains this feedback question in layman’s terms.  The second half shows some attempts to quantify feedback.  His message is basically that no one knows even the sign and much less the magnitude of feedback, but the empirical data we are starting to see (which has admitted flaws) points to negative rather than positive feedback, at least in the short term.  His analysis looks at the change in radiative heat transfer in and out of the earth as measured by satellites around transient peaks in ocean temperatures (oceans are the world’s temperature flywheel — most of the Earth’s surface heat content is in the oceans).

Read it all, but this is an interesting note:

In fact, NO ONE HAS YET FOUND A WAY WITH OBSERVATIONAL DATA TO TEST CLIMATE MODEL SENSITIVITY. This means we have no idea which of the climate models projections are more likely to come true.

This dirty little secret of the climate modeling community is seldom mentioned outside the community. Don’t tell anyone I told you.

This is why climate researchers talk about probable ranges of climate sensitivity. Whatever that means!…there is no statistical probability involved with one-of-a-kind events like global warming!

There is HUGE uncertainty on this issue. And I will continue to contend that this uncertainty is a DIRECT RESULT of researchers not distinguishing between cause and effect when analyzing data.

If you find this topic interesting, I recommend my video and/or powerpoint presentation to you.

A Thought on “Short Term”

One interesting fact is that alarmists have to deal with the lack of warming or increase in ocean heat content over the last 12 years or so.  They will argue that this is just a temporary aberration, and a much shorter time frame than they are working on.    Let’s think about that.

Here is the core IPCC argument:  for the period after 1950, they claim their computer models cannot explain warming patterns without including a large effect from anthropogenic CO2.  Since almost all the warming in the latter half of the century really occurred between 1978 and 1998, the IPCC core argument boils down to “we are unable to attribute the global temperature increase in these 20 years to natural factors, so it must have been caused by man-made CO2.”  See my video here for a deeper discussion.

In effect, the core IPCC conclusions were really based on the warming over the 20 years from 1978-1998.  There was never any implication that their models couldn’t explain, say, the 1930’s or the 1970’s without manmade CO2.

So while 12 years is admittedly short compared to many natural cycles in climate, and might be considered a dangerously short period to draw conclusions from, it is fairly large compared to the 20 year period that drove the IPCC conclusions.

Here is where we stand:  The IPCC models supposedly cannot explain the 20 year period from 1978-1998 without factoring in a high climate sensitivity to CO2.  However, I would venture to guess that, prior to tweaking, the IPCC models cannot explain the 12 year period from 1998-2011 while still factoring in a high climate sensitivity to CO2.

Postscript:  I suppose the IPCC would scream “aerosols,” but even putting aside the equivocal and sometimes offsetting effects of aerosols and black carbon, I do not think one could reasonably argue their effect was much greater in one period than the other.

Climate Science Process Explained

Normally, when I cite the above as the process, I get grief from folks who say I am mis-interpreting things, as usually I am boiling a complex argument down to this summary.   The great thing about alarmist Trenberth’s piece is that no interpretation is necessary.   He outlines this process right in a single paragraph.  I will label the four steps above

Given that global warming is “unequivocal” [1], to quote the 2007 IPCC report [2], the null hypothesis should now be reversed, thereby placing the burden of proof on showing that there is no human influence [3]. Such a null hypothesis is trickier because one has to hypothesize something specific, such as “precipitation has increased by 5%” and then prove that it hasn’t. Because of large natural variability, the first approach results in an outcome suggesting that it is appropriate to conclude that there is no increase in precipitation by human influences, although the correct interpretation is that there is simply not enough evidence (not a long enough time series). However, the second approach also concludes that one cannot say there is not a 5% increase in precipitation. Given that global warming is happening and is pervasive, the first approach should no longer be used. As a whole the community is making too many type II errors [4].

Are you kidding me — if already every damn event in the tails of the normal distribution is taken by the core climate community as a proof of their hypothesis, how is there even room for type II errors?  Next up — “Our beautiful, seasonal weather — proof of global warming?”

Remember that the IPCC’s conclusion of human-caused warming was based mainly on computer modelling.  The IPCC defenders will not admit this immediately, but press them hard enough on side arguments and it comes down to the models.

The summary of their argument is this:  for the period after 1950, they claim their computer models cannot explain warming patterns without including a large effect from anthropogenic CO2.  Since almost all the warming in the latter half of the century really occurred between 1978 and 1998, the IPCC core argument boils down to “we are unable to attribute the global temperature increase in these 20 years to natural factors, so it must have been caused by man-made CO2.”  See my video here for a deeper discussion.

This seems to be a fairly thin reed.  After all, it may just be that after only a decade or two of serious study, we still do not understand climate variability very well, natural or not.  It is a particularly odd conclusion when one discovers that the models ignore a number of factors (like the PDO, ENSO, etc) that affect temperatures on a decadal scale.

We therefore have a hypothesis that is not based on observational data, and where those who hold the hypothesis claim that observational data should no longer be used to test their hypothesis.    He is hilarious when he says that reversing the null hypothesis would make it trickier for his critics.  It would make it freaking impossible, as he very well knows.  This is an unbelievingly disingenuous suggestion.  There are invisible aliens in my closet Dr. Trenberth — prove me wrong.  It is always hard to prove a negative, and impossible in the complex climate system.  There are simply too many variables in flux to nail down cause and effect in any kind of definitive way, at least at our level of understanding  (we have studied economics much longer and we still have wild disagreements about cause and effect in macroeconomics).

He continues:

So we frequently hear that “while this event is consistent with what we expect from climate change, no single event can be attributed to human induced global warming”. Such murky statements should be abolished. On the contrary, the odds have changed to make certain kinds of events more likely. For precipitation, the pervasive increase in water vapor changes precipitation events with no doubt whatsoever. Yes, all events! Even if temperatures or sea surface temperatures are below normal, they are still higher than they would have been, and so too is the atmospheric water vapor amount and thus the moisture available for storms. Granted, the climate deals with averages. However, those averages are made up of specific events of all shapes and sizes now operating in a different environment. It is not a well posed question to ask “Is it caused by global warming?” Or “Is it caused by natural variability?” Because it is always both.

At some level, this is useless.   The climate system is horrendously complex.  I am sure everything affects everything.  So to say that it affects the probability is a true but unhelpful statement.   The concern is that warming will affect the rate of these events, or the severity of these events, in a substantial and noticeable way.

It is worth considering whether the odds of the particular event have changed sufficiently that one can make the alternative statement “It is unlikely that this event would have occurred without global warming.” For instance, this probably applies to the extremes that occurred in the summer of 2010: the floods in Pakistan, India, and China and the drought, heat waves and wild fires in Russia.

Did Your SUV Cause the Earthquake in Haiti?

The other day, environmental blog the Thin Green Line wrote:

At the American Geophysical Union meeting late last month, University of Miami geologist Shimon Wdowinski argued that the devastating earthquake a year ago may have been caused by a combination of deforestation and hurricanes (H/T Treehugger). Climate change is spurring more, stronger hurricanes, which are fueled by warm ocean waters….

The 2010 disaster stemmed from a vertical slippage, not the horizontal movements that most of the region’s quakes entail, supporting the hypothesis that the movement was triggered by an imbalance created when eroded land mass was moved from the mountainous epicenter to the Leogane Delta.

I have heard this theory before, that landslides and other surface changes can trigger earthquakes.  Now, I am not expert on geology — it is one of those subjects that always seems like it would be interesting to me but puts me in a coma as soon as I dive into it.   I almost failed a pass-fail geology course in college because in the mineral identification section, all I could think to say was “that’s a rock.”

However, I do know enough to say with some confidence that surface land changes may have triggered but did not cause the earthquake.  Earthquakes come from large releases of stored energy, often between plates and faults.  It’s remotely possible land surface changes trigger some of these releases, but in general I would presume the releases would happen at some point anyway.  (Steven Goddard points out the quake was 13km below the surface, and says “It is amazing that anyone with a scientific background could attempt to blame it on surface conditions.”)

The bit I wanted to tackle was the Thin Green Line’s statement that “Climate change is spurring more, stronger hurricanes.”   This is a fascinating statement I want to attack from several angles.

First, at one level it is a mere tautology.  If we are getting more hurricanes, then by definition the climate has changed.   This is exactly why “global warming” was rebranded into “climate change,” because at some level, the climate is always changing.

Second, the statement is part of a fairly interesting debate on whether global warming in general will cause more hurricanes.  Certainly hurricanes get their power from warm water in the oceans, so it is not unreasonable to hypothesize that warmer water would lead to more, stronger hurricanes.  It turns out the question, as are most all questions in the complex climate, is more complicated than that.  It may be hurricanes are driven more by temperature gradients, rather than absolute temperatures, such that a general warming may or may not have an effect on their frequency.

Third, the statement in question, as worded, is demonstrably wrong.  If he had said “may someday spur more hurricanes,” he might have been OK, but he said that climate change, and by that he means global warming, is spurring more hurricanes right now.

Here is what is actually happening (paragraph breaks added)

2010 is in the books: Global Tropical Cyclone Accumulated Cyclone Energy [ACE] remains lowest in at least three decades, and expected to decrease even further… For the calendar year 2010, a total of 46 tropical cyclones of tropical storm force developed in the Northern Hemisphere, the fewest since 1977. Of those 46, 26 attained hurricane strength (> 64 knots) and 13 became major hurricanes (> 96 knots).

Even with the expected active 2010 North Atlantic hurricane season, which accounts on average for about 1/5 of global annual hurricane output, the rest of the global tropics has been historically quiet. For the calendar-year 2010, there were 66-tropical cyclones globally, the fewest in the reliable record (since at least 1970) The Western North Pacific in 2010 had 8-Typhoons, the fewest in at least 65-years of records. Closer to the US mainland, the Eastern North Pacific off the coast of Mexico out to Hawaii uncorked a grand total of 8 tropical storms of which 3 became hurricanes, the fewest number of hurricanes since at least 1970.

Global, Northern Hemisphere, and Southern Hemisphere Tropical Cyclone Accumulated Energy (ACE) remain at decades-low levels.

The source link has more, and graphs of ACE over the last several decades (ACE is a sort of integral, combining the time-average-strength of all hurricanes during the year.  This is a better metric than mere counts and certainly better than landfall or property damage metrics).

So, normally I would argue with alarmists that correlation is not causation.   There is no point in arguing about causation, though, because the event he claims to have happened (more and stronger hurricanes) did not even happen.  The only way he could possibly argue it (though I am pretty sure he has never actually looked at the hurricane data and simply works from conventional wisdom in the global warming echo chamber) is to say that yes, 2010 was 40-year low in hurricanes, but it would have been even lower had it not been for global warming.  This is the Obama stimulus logic, and is just as unsupportable here as it was in that context.

Postscript: By the way, 2010 was probably the second warmest year in the last 30-40 years and likely one of the 5-10 warmest in the last century, so if warming was going to be a direct cause of hurricanes, it would have been in 2010.    And yes, El Ninos and La Ninas and such make it all more complicated.  Exactly.  See this post.

Suddenly, Skepticism of Peer-Reviewed Science is OK

Cross-posted at Coyote Blog

Wow, suddenly skepticism, and even outright harsh criticism, of peer-reviewed work is OK, as long as it is not in climate I suppose.

On Thursday, Dec. 2, Rosie Redfield sat down to read a new paper called “A Bacterium That Can Grow by Using Arsenic Instead of Phosphorus.” Despite its innocuous title, the paper had great ambitions. Every living thing that scientists have ever studied uses phosphorus to build the backbone of its DNA. In the new paper, NASA-funded scientists described a microbe that could use arsenic instead. If the authors of the paper were right, we would have to expand our….

As soon Redfield started to read the paper, she was shocked. “I was outraged at how bad the science was,” she told me.

Redfield blogged a scathing attack on Saturday. Over the weekend, a few other scientists took to the Internet as well. Was this merely a case of a few isolated cranks? To find out, I reached out to a dozen experts on Monday. Almost unanimously, they think the NASA scientists have failed to make their case. “It would be really cool if such a bug existed,” said San Diego State University’s Forest Rohwer, a microbiologist who looks for new species of bacteria and viruses in coral reefs. But, he added, “none of the arguments are very convincing on their own.” That was about as positive as the critics could get. “This paper should not have been published,” said Shelley Copley of the University of Colorado.

The article goes on to describe many potential failures in the methodology.  None of this should be surprising — I have written for years that peer-review is by no means proof against bad science or incorrect findings.  It is more of an  extended editorial process.  The real test of published science comes later, when the broader community attempts to replicate results.

The problem in climate science has been that its proponents want to claim that having research performed by a small group of scientists that is peer-reviewed by the same small group is sufficient to making the results “settled science.”  Once published, they argue, no one (certainly not laymen on blogs) has the right to criticize it, and the researchers don’t (as revealed in the Climategate emails) have any obligations to release their data or code to allow replication.   This is just fresh proof that this position is nuts.

The broken climate science process is especially troubling given the budgetary and reputational incentives to come out with the most dramatic possible results, something NASA’s James Hansen has been accused of doing by many climate skeptics.  To this end, consider this from the bacteria brouhaha.  First, we see the same resistance to criticism, trying to deflect any critiques outside of peer-reviewed journals

“Any discourse will have to be peer-reviewed in the same manner as our paper was, and go through a vetting process so that all discussion is properly moderated,” wrote Felisa Wolfe-Simon of the NASA Astrobiology Institute. “The items you are presenting do not represent the proper way to engage in a scientific discourse and we will not respond in this manner.”

WTF?  How, then, did we ever have scientific process before peer-reviewed journals appeared on the scene?

But Jonathan Eisen of UC-Davis doesn’t let the scientists off so easily. “If they say they will not address the responses except in journals, that is absurd,” he said. “They carried out science by press release and press conference. Whether they were right or not in their claims, they are now hypocritical if they say that the only response should be in the scientific literature.”

Wow, that could be verbatim from a climate skeptic in the climate debate.

And finally, this on incentives and scientific process:

Some scientists are left wondering why NASA made such a big deal over a paper with so many flaws. “I suspect that NASA may be so desperate for a positive story that they didn’t look for any serious advice from DNA or even microbiology people,” says John Rothof UC-Davis.

A Really Bad Idea

I know lots of your disagree with me on this, but it needs to be said.  I have had people argue that , well, its about management of public funds, but compared to what the average university wastes, this is trivial.  The funds management issue is just window dressing, in my view, for people looking for a heaping helping of retribution. Cross posted from Coyote Blog

Regular readers will have no doubts about my skepticism of the theory of catastrophic man-made global warming.  In particular, in these pages and at Coyote Blog, I have repeatedly criticized the details of Michael Mann’s work on the hockey stick.  I won’t repeat those issues today, though some of the past articles are indexed here.  Or watch my video linked to the right, it has plenty of stuff about the hockey stick.

That being said, efforts by Republicans in Virginia to bring legislative or even criminal action against Mann for his work when he was at the University of Virginia is about the worst idea I have heard in quite some time.  Though nominally about forcing public disclosure (something I am always in favor of from state entities) the ultimate goal is to drag Mann into court

Cuccinelli has said he wants to see whether a fraud investigation would be warranted into Mann’s work, which showed that the earth has experienced a rapid, recent warming

[As an aside, this is actually NOT what Mann’s hockey stick work purports to show.  The point of the hockey stick is to make the case that historic temperatures before 1850 were incredibly stable and flat, and thus recent increases of 0.6-0.8C over the last 150 years are unprecedented in comparison.   His research added nothing to our knowledge about recent warming, it was on focused on pre-industrial warming.   The same folks that say with confidence the science is settled don’t even understand it].

For those frustrated with just how bad Mann’s work is and upset at the incredible effort to protect this work from criticism or scrutiny by hiding key data (as documented in the East Anglia climategate emails), I know it must feel good to get some sort of public retribution.  But the potential precedent here of bringing up scientists on charges essentially for sloppy or incorrect work is awful.

Bad science happens all the time, completely absent any evil conspiracies.  Human nature is to see only the data that confirms ones hypotheses and, if possible, to resists scrutiny and criticism.  This happens all the time in science and if we started hauling everyone into court or into a Senate committee, we have half of academia there  (and then likely the other half when the party in power changed).  Team politics are a terrible disease and the last thing we need is to drag them any further into science and academia.

Science will eventually right itself, and what is needed is simply the time and openness to allow adversarial scrutiny and replication within academia to run its course.  Seriously, are we next going to drag the cold fusion guys in to court?  How about all the folks in the geology field that resisted plate tectonics for so long.  Will we call to account the losers in the string theory debate?

If legislators want to help, they can

  • Make sure there are standards in place for archiving and public availability of any data and code associated with government funded research
  • Improve the governments own climate data management
  • Ensure that state funding is distributed in a way to support a rich dialog on multiple sides of contested scientific issues.

Nissan Leaf MPG Numbers Very Flawed

Cross-posted from Coyote Blog

The EPA has done the fuel economy rating for the all-electric Nissan Leaf.  I see two major problems with it, but first, here is the window sticker, from this article

Problem #1:  Greenhouse gas estimate is a total crock.  Zero?

The Greenhouse gas rating, in the bottom right corner, is that the car produces ZERO greenhouse gasses.  While I suppose this is technically true, it is wildly misleading.  In almost every case, the production of the electricity to charge the car does create greenhouse gasses.  One might argue the answer is zero in the Pacific Northwest where most power is hydro, but even in heavy hydro/nuclear areas, the incremental marginal demand is typically picked up by natural gas turbines.  And in the Midwest, the Leaf will basically be coal powered, and studies have shown it to create potentially more CO2 than burning gasoline.  I understand that this metric is hard, because it depends on where you are and even what time of day you charge the car, but the EPA in all this complexity chose to use the one number – zero – that is least likely to be the correct answer.

Problems #2:  Apples and oranges comparison of electricity and gasoline.

To understand the problem, look at the methodology:

So, how does the EPA calculate mpg for an electric car? Nissan’s presser says the EPA uses a formula where 33.7 kWhs are equivalent to one gallon of gasoline energy

To get 33.7 kWhs to one gallon, they have basically done a conversion through BTUs — ie 1 KWh = 3412 BTU and one gallon of gasoline releases 115,000 BTU of energy in combustion.

Am I the only one that sees the problem?  They are comparing apples and oranges.  The gasoline number is a potential energy number — which given inefficiencies (not to mention the second law of thermodynamics) we can never fully capture as useful work out of the fuel.  They are measuring the potential energy in the gasoline before we start to try to convert it to a useful form.  However, with electricity, they are measuring the energy after we have already done much of this conversion and suffered most of the losses.

They are therefore giving the electric vehicle a huge break.  When we measure mpg on a traditional car, the efficiency takes a hit due to conversion efficiencies and heat losses in combustion.  The same thing happens when we generate electricity, but the electric car in this measurement is not being saddled with these losses while the traditional car does have to bear these costs.  Measuring how efficient the Leaf is at using electricity from an electric outlet is roughly equivalent to measuring how efficient my car is at using the energy in the drive shaft.

An apples to apples comparison would compare the traditional car’s MPG with the Leaf’s miles per gallon of gasoline (or gasoline equivalent) that would have to be burned to generate the electricity it uses.  Even if a power plant were operating at 50% efficiency (which I think is actually high and ignores transmission losses) this reduces the Leaf’s MPG down to 50, which is good but in line with several very efficient traditional cars.