All posts by admin

100 Months to the Tipping Point

Wow — it turns out that after hundreds of millions or even billions of years of remaining stable, the world climate will, due to (at most) a few tenths of degrees of man-made warming and an increase of a trace gas composition in the atmosphere by about 0.01%, go past its tipping point or point of no return and run away to catastrophe.  I sure wish there was a prediction market where I could bet against this.  See this end of the world website here (HT to a reader). 

Given a bit more time, I will try to take on in depth the underlying article behind this site.  But for now, suffice it to say that underlying hypothesis is that the world’s climate is dominated by positive feedback, a hypothesis, if true, that would set climate apart from nearly every other natural process that we know of.  In fact, the only major natural process I can think of that is dominated by positive feedback and tipping points is nuclear fission.  Here are many articles on how catastrophic forecasts assume large positive feedbacks and why this assumption is unlikely.

Global Warming “Fingerprint”

Many climate scientists say they see a "fingerprint" in recent temperature increases that they claim is distinctive and makes current temperature increases different from past "natural" temperature increases. 

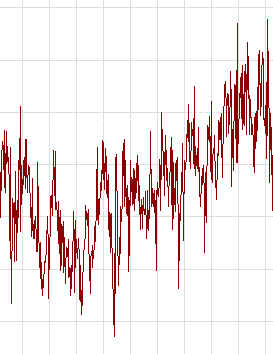
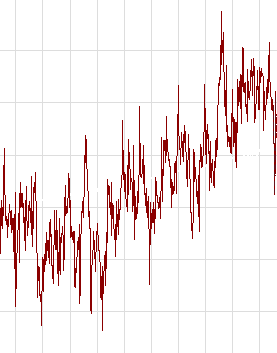
So, to see if we are all as smart as the climate scientists, here are two 51-year periods from the 20th century global temperature record as provided by the Hadley CRUT3.  Both are scaled the same (each line on the y-axis is 0.2C, each x-axis division is 5 years) — in fact, both are clips from the exact same image.  So, which is the anthropogenic warming and which is the natural? 

  Periodb       Perioda_3

One clip is from 1895 to 1946 (the"natural" period) and one is from 1957 to present  (the supposedly anthropogenic period). 

If you have stared at these charts long enough, the el Nino year of 1998 has a distinctive shape that I recognize, but otherwise these graphs look surprisingly similar.  If you are still not sure, you can find out which is which here.

Measuring Climate Sensitivity

As I am sure most of my readers know, most climate models do not reach catastrophic temperature forecasts from CO2 effects alone.  In these models, small to moderate warming by CO2 is multiplied many fold by assumed positive feedbacks in the climate system.  I have done some simple historical analyses that have demonstrated that this assumption of massive positive feedback is not supported historically.

However, many climate alarmists feel they have good evidence of strong positive feedbacks in the climate system.  Roy Spencer has done a good job of simplifying his recent paper on feedback analysis in this article.  He looks at satellite data from past years and concludes:

We see that the data do tend to cluster along an imaginary line, and the slope of that line is 4.5 Watts per sq. meter per deg. C. This would indicate low climate sensitivity, and if applied to future global warming would suggest only about 0.8 deg. C of warming by 2100.

But he then addresses the more interesting issue of reconciling this finding with other past studies of the same phenomenon:

Now, it would be nice if we could just stop here and say we have evidence of an insensitive climate system, and proclaim that global warming won’t be a problem. Unfortunately, for reasons that still remain a little obscure, the experts who do this kind of work claim we must average the data on three-monthly time scales or longer in order to get a meaningful climate sensitivity for the long time scales involved in global warming (many years).

One should always before of a result where the raw data yield one result but averaged data yields another.  Data averaging tends to do funny things to mask physical processes, and this appears to be no exception here.  He creates a model of the process, and finds that such averaging always biases the feedback result higher:

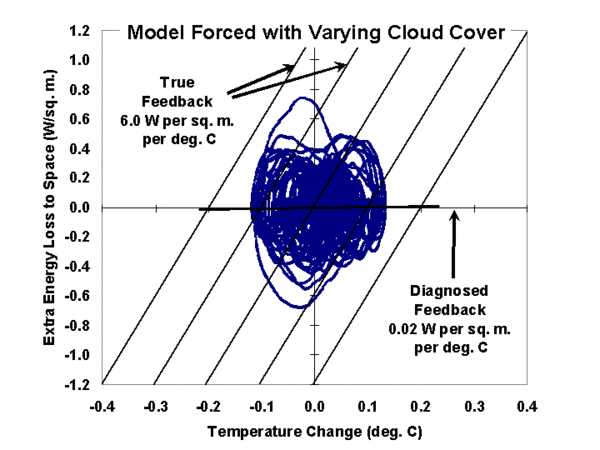
Significantly, note that the feedback parameter line fitted to these data is virtually horizontal, with almost zero slope. Strictly speaking that would represent a borderline-unstable climate system. The same results were found no matter how deep the model ocean was assumed to be, or how frequently or infrequently the radiative forcing (cloud changes) occurred, or what the specified feedback was. What this means is that cloud variability in the climate system always causes temperature changes that "look like" a sensitive climate system, no matter what the true sensitivity is.

In short, each time he plugged low feedback into the model, the data that emerged mimicked that of a high feedback system, with patterns very similar to what researchers have seen in past feedback studies of actual temperature data. 

Interestingly, the pattern is sort of a circular wandering pattern, shown below:Simplemodelradiativeforcing

I will have to think about it a while — I am not sure if it is a real or spurious comparison, but the path followed by his model system is surprisingly close to that in the negative feedback system I modeled in my climate video, that of a ball in the bottom of a bowl given a nudge (about 3 minutes in).

No Trend in Drought or Floods

It is often said by warming alarmists that a) global warming will increase both extremes of droughts and floods and b) that we already see these conditions accelerating  (ie with California droughts and this year’s midwestern floods).  The recent NOAA/NASA draft CCSP climate change report I commented on last week said

Temperature and precipitation have increased over recent decades, along with some extreme weather events such as heat waves and heavy downpours…

Widespread increases in heavy precipitation events have occurred, even in places where total amounts have decreased. These changes are associated with the fact that warmer air holds more water vapor evaporating from the world’s oceans and land surface. Increases in drought are not uniform, and some regions have seen increases in the occurrences of both droughts and floods

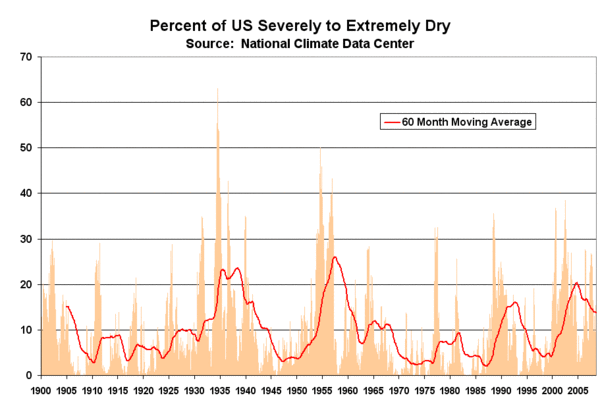
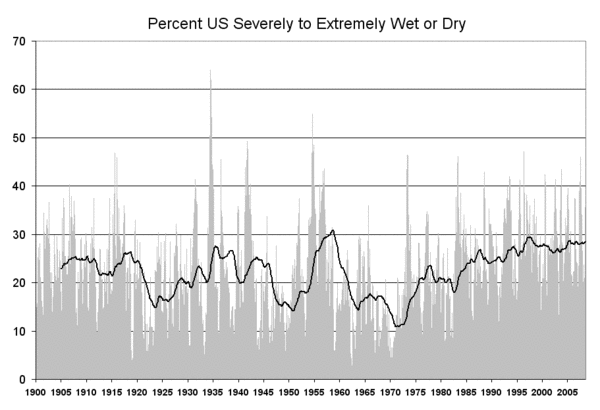
The Antiplanner, in an article on firefighting, shares this data at the National Climate Data Center that I had never seen before.  It is the monthly estimate of the percent of US land area subject to extremes of wet or dry weather.  First, the dry weather:

Dry_2

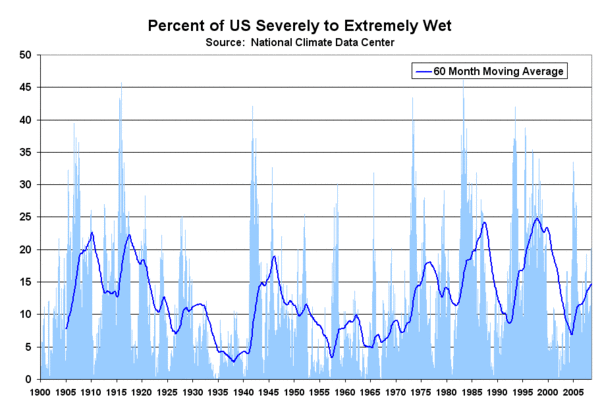
Then the wet weather:

Wet

There is no trend here, and certainly no acceleration** of a trend, merely what is obviously a cyclical phenomenon.   

** I am constantly amazed at the ability of alarmists to dedice the second derivitive of natural phenomenon (eg an acceleration in a rate of change) from single data points (e.g. 2008 flooding in the Midwest).

Update:  Since the claim is an increase in total extreme weather, to be fair I also looked at the history of the two data sets above combined:

Wetanddry

Thre is a slight trend here, on the order of about a 2-3 percentage point increase per century.  I am fairly certain this does not clear the margin of error. 

Because, You Know, All We Skeptics Are Fighting Against Settled Science

I saw Al’s climate sci-fi movie, but I didn’t read the book.  Via Tom Nelson, Robert Johnston has a refutation of some of Al’s claims in his book.  This one caught my eye because it is a topic with which I am pretty familiar.  Gore writes:

"People who want to deny global warming because it’s easier than dealing with it try to argue that what scientists are really observing is just the ‘urban heat island’ effect… This is simply wrong. Temperature measurements are generally taken in parks, which are actually cool areas within the urban heat islands… Most scientific research shows that ‘urban heat islands’ have a negligible effect…" (p. 318)

I can’t believe we let Al Gore lecture us on science.  A few responses:

  • I don’t think most skeptics deny that some warming has occurred in the 20th century.  Satellite measurement, which is not subject to urban heat island biases, has shown several tenths of a degree C warming since the late 1970’s.  However, skeptics do tend to argue that surface temperature networks do tend to overestimate the 20th century warming signal due in part to urban biases  (not to mention over-zealous addition of fudge-factors by the alarmists running the data gathering). Of course, we also will dispute that "most" of this warming is due to anthropogenic CO2.
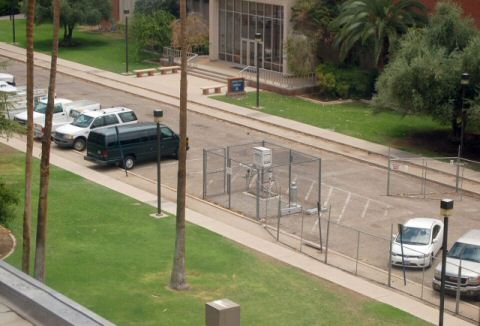
  • The statement that most temperature measurements are taken in parks is so wrong as to be absurd.  As Anthony Watts SurfaceStations.org climate station survey process has shown, the vast majority of stations are actually located near buildings  (a predictable result of siting and cable length limitations of the most commonly used sensors).  You don’t have to take my word for it, just scan the pictures yourself at random.  I have had a lot of fun participating in this project.  Here, by the way, is the Tucson station I surveyed.  As you can see, the station is definitely located in a park[ing lot].

Tucson1

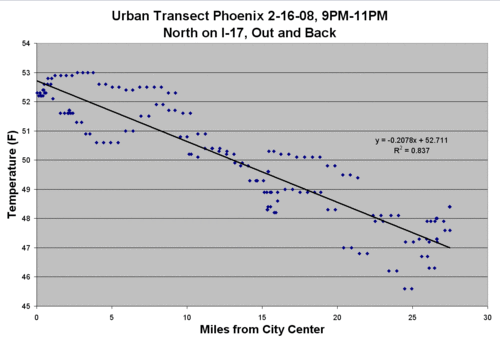
  • We skeptics are often called "deniers" for not accepting that the theory of catastrophic man-made global warming is settled science.  But if you want to see real denialism in the face of facts, one only has to look at the alarmist’s absurd position that, as Al Gore puts it, "urban heat islands have a negligible effect."  The fact is that urban heat islands are well-known to science, and can cause the center of cities to be as high as 5-8C hotter than the outlying rural areas.  It turns out that this is so horribly difficult to understand and prove that … my 14-year-old son did it for a science project.  Here is the results of one of our data runs across town  (details described in the article).

Phoenixrun1

  • Defenders of the surface temperature record will sometimes argue that they have successfully corrected for urban biases (leading to the cognitive dissonance of their saying that the biases have no effect and that they have fully corrected for them).  But here is the problem:  without detailed siting information, and surveys like that run by my son, it is impossible to make these corrections anything but guesses (ironically, many of the folks making this argument have opposed Anthony Watt’s survey process and continue to maintain that they can make better adjustments blind than having data of station siting).  At most, the total warming signal we are trying to identify over the last century is about a degree F.  But as you can see above, we found a 6 degree urban heat effect on the first night of our study, and we found a 9 degree urban effect our second night.  You can see that not only does the magnitude of this heat island effect swamp the signal we are trying to measure, even the variability or uncertainty in assessing the urban bias is several times larger than the warming signal. 

Update:  Here is a new study debunking Gore’s claim that man-made global warming was melting the Kilimanjaro ice cap.  This claim never made much sense, since even if temperatures were to warm by several degrees, they would still remain well below freezing all year long.

Climate Tourism

While driving between some of the campgrounds we run in Inyo and Mono County, California, I stumbled across the White Mountain bristle-cone pine forest.  I just couldn’t resist checking it out.  Of course, it through me off my schedule for an hour or so, but its not the first time that bristle-cones have been a source of divergence ;=)

PS-  I had a crappy rent car, but if you have a sports car and are near Highway 168 east of Big Pine, CA, you should definitely give it a test drive.  It would be a real hoot to drive with the right car.

Comments on NOAA USP Draft

As promised, here are my comments on the USP Global Climate Change draft.  I simply did not have the time to plow through the entire NOAA/NASA CCSP climate change report, so I focused on the 28-page section labeled Global Climate Change.  Even then, I was time-crunched, so most of my comments are cut-and-pastes from my blog, and many lack complete citations.  I would feel bad about that, except the USP report itself is very clearly a haphazard cut-and-paste from various sources and many of its comments and charts totally lack citations and sources (I challenge you to try to figure out even simple things, like where the 20th century temperature data on certain charts came from).

Backcasting with Computer Climate Models

I found the chart below in the chapter Global Climate Change of the NOAA/NASA CCSP climate change report. (I discuss this report more here). I thought it was illustrative of some interesting issues:

Temp

The Perfect Backcast

What they are doing is what I call "backcasting," that is, taking a predictive model and running it backwards to see how well it preforms against historical data.  This is a perfectly normal thing to do.

And wow, what a fit.  I don’t have the data to do any statistical tests, but just by eye, the red model output line does an amazing job at predicting history.  I have done a lot of modeling and forecasting in my life.  However, I have never, ever backcast any model and gotten results this good.  I mean it is absolutely amazing.

Of course, one can come up with many models that backcast perfectly but have zero predictive power

A recent item of this ilk maintains that the results of the last game played at home by the NFL’s Washington Redskins (a football team based in the national capital, Washington, D.C.) before the U.S. presidential elections has accurately foretold the winner of the last fifteen of those political contests, going back to 1944. If the Redskins win their last home game before the election, the party that occupies the White House continues to hold it; if the Redskins lose that last home game, the challenging party’s candidate unseats the incumbent president. While we don’t presume there is anything more than a random correlation between these factors, it is the case that the pattern held true even longer than claimed, stretching back over seventeen presidential elections since 1936.

And in fact, our confidence in the climate models based on their near-perfect back-casting should be tempered by the fact that when the models first were run backwards, they were terrible at predicting history.  Only a sustained effort to tweak and adjust and plug them has resulted in this tight fit  (we will return to the subject of plugging in a minute).

In fact, it is fairly easy to demonstrate that the models are far better at predicting history than they are at predicting the future.  Like the Washington Redskins algorithm, which failed in 2004 after backcasting so well, climate models have done a terrible job in predicting the first 10-20 years of the future.  This is the reason that neither this nor any other global warming alarmist report every shows a chart grading how model forecasts have performed against actual data:  Because their record has been terrible.  After all, we have climate model forecasts data all the way back from the late 1980’s — surely 20+ years is enough to get a test of their performance.

Below is the model forecasts James Hansen, whose fingerprints are all over this report, used before Congress in 1988 (in yellow, orange, and red), with a comparison to the actual temperature record (in blue).  (source)
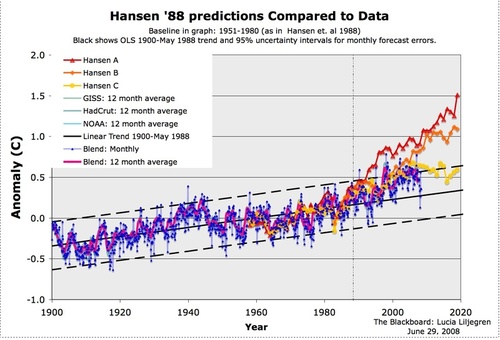
Hansenlineartrend

Here is the detail from the right side:
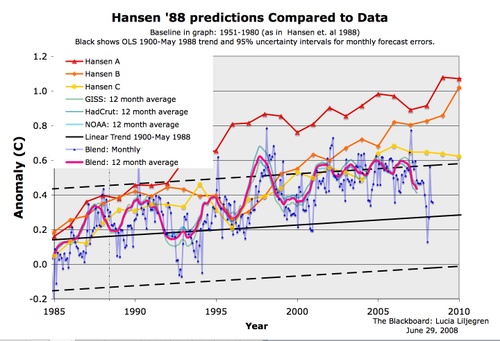
Hansencomparedrecent

You can see the forecasts began diverging from reality even as early as 1985.  By the way, don’t get too encouraged by the yellow line appearing to be fairly close — the Hansen C case in yellow was similar to the IPCC B1 case which hypothesizes strong international CO2 abatement programs which have not come about.  Based on actual CO2 production, the world is tracking, from a CO2 standpoint, between the orange and red lines.  However, temperature is no where near the predicted values.

So the climate models are perfect at predicting history, but begin diverging immediately as we move into the future.  That is probably why the IPCC resets its forecasts every 5 years, so they can hit the reset button on this divergence.  As an interesting parallel, temperature measurements of history with trees have very similar divergence issues when carried into the future.

What the Hell happened in 1955?

Looking again at the backcast chart at the top of this article, peek at the blue line.  This is what the models predict to have been the world temperature without man-made forcings.  The blue line is supposed to represent the climate absent man.  But here is the question I have been asking ever since I first started studying global warming, and no one has been able to answer:  What changed in the Earth’s climate in 1955?  Because, as you can see, climate forecasters are telling us the world would have reversed a strong natural warming trend and started cooling substantially in 1955 if it had not been for anthropogenic effects.

This has always been an issue with man-made global warming theory.  Climate scientists admit the world warmed from 1800 through 1955, and that most of this warming was natural.  But somehow, this natural force driving warming switched off, conveniently in the exact same year when anthropogenic effects supposedly took hold.  A skeptical mind might ask why current warming is not just the same natural trend as warming up to 1955, particularly since no one can say with any confidence why the world warmed up to 1955 and why this warming switched off and reversed after that.

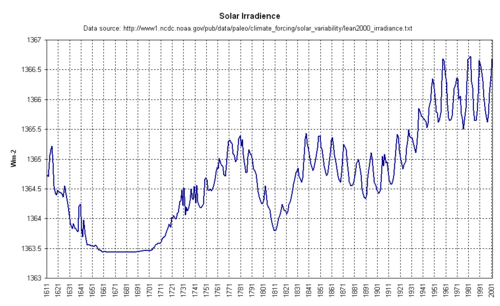
Well, lets see if we can figure it out.  The sun, despite constant efforts by alarmists to portray it is climactically meaningless, is a pretty powerful force.  Did the sun change in 1955? (click to enlarge)
Irradiance

Well, it does not look like the sun turned off.  In fact, it appears that just the opposite was happening — the sun hit a peak around 1955 and has remained at this elevated level throughout the current supposedly anthropogenic period.

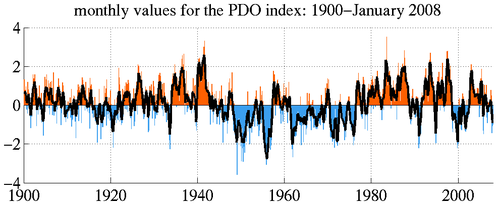
OK, well maybe it was the Pacific Decadal Oscillation?  The PDO goes through warm and cold phases, and its shifts can have large effects on temperatures in the Northern Hemisphere.
Pdo_monthly

Hmm, doesn’t seem to be the PDO.  The PDO turned downwards 10 years before 1955.  And besides, if the line turned down in 1955 due to the PDO, it should have turned back up in the 1980’s as the PDO went to its warm phase again. 

So what is it that happened in 1955.  I can tell you:  Nothing. 

Let me digress for a minute, and explain an ugly modeling and forecasting concept called a "plug".  It is not unusual that when one is building a model based on certain inputs (say, a financial model built from interest rates and housing starts or whatever) that the net result, while seemingly logical, does not get to what one thinks the model should be saying.  While few will ever admit it, I have been inside the modeling sausage factory for enough years that it is common to add plug figures to force a model to reach an answer one thinks it should be reaching — this is particularly common after back-casting a model.

I can’t prove it, any more than this report can prove the statement that man is responsible for most of the world’s warming in the last 50 years.  But I am certain in my heart that the blue line in the backcasting chart is a plug.  As I mentioned earlier, modelers had terrible success at first matching history with their forecasting models.  In particular, because their models showed such high sensitivity of temperature to CO2 (this sensitivity has to be high to get catastrophic forecasts) they greatly over-predicted history. 

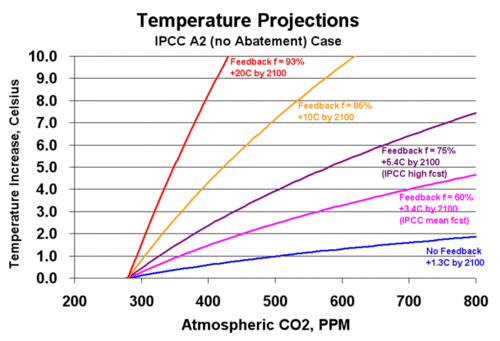
Here is an example.  The graph below shows the relationship between CO2 and temperature for a number of sensitivity levels  (the shape of the curve was based on the IPCC formula and the process for creating this graph was described here).
Agwforecast1

The purple lines represent the IPCC forecasts from the fourth assessment, and when converted to Fahrenheit from Celsius approximately match the forecasts on page 28 of this report.  The red and orange lines represent more drastic forecasts that have received serious consideration.  This graph is itself a simple model, and we can actually backcast with it as well, looking at what these forecasts imply for temperature over the last 100-150 years, when CO2 has increased from 270 ppm to about 385 ppm.
Agwforecast2

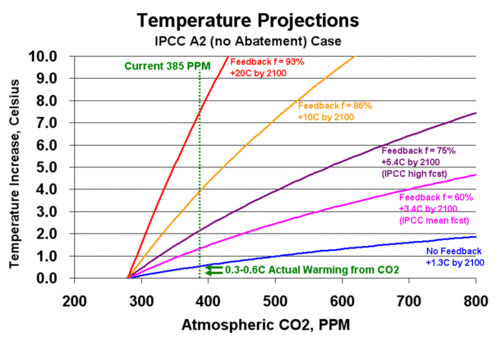
The forecasts all begin at zero at the pre-industrial number of 270ppm.  The green dotted line is the approximate concentration of CO2 today.  The green 0.3-0.6C arrows show the reasonable range of CO2-induced warming to date.  As one can see, the IPCC forecasts, when cast backwards, grossly overstate past warming.  For example, the IPCC high case predicts that we should have see over 2C warming due to CO2 since pre-industrial times, not 0.3 or even 0.6C

Now, the modelers worked on this problem.   One big tweak was to assign an improbably high cooling effect to sulfate aerosols.  Since a lot of these aerosols were produced in the late 20th century, this reduced their backcasts closer to actuals.  (I say improbably, because aerosols are short-lived and cover a very limited area of the globe.  If they cover, say, only 10% of the globe, then their cooling effect must be 1C in their area of effect to have even a small 0.1C global average effect).

Even after these tweaks, the backcasts were still coming out too high.  So, to make the forecasts work, they asked themselves, what would global temperatures have to have done without CO2 to make our models work?  The answer is that if the world naturally were to have cooled in the latter half of the 20th century, then that cooling could offset over-prediction of temperatures in the models and produce the historic result.  So that is what they did.  Instead of starting with natural forcings we understand, and then trying to explain the rest  (one, but only one, bit of which would be CO2), modelers start with the assumption that CO2 is driving temperatures at high sensitivities, and natural forcings are whatever they need to be to make the backcasts match history.

By the way, if you object to this portrayal, and I will admit I was not in the room to confirm that this is what the modelers were doing, you can do it very simply.  Just tell me what substantial natural driver of climate, larger in impact that the sun or the PDO, reversed itself in 1955.

A final Irony

I could go on all day making observations on this chart, but I would be surprised if many readers have slogged it this far.  So I will end with one irony.  The climate modelers are all patting themselves on the back for their backcasts matching history so well.  But the fact is that much of this historical temperature record is fraught with errors.  Just as one example, measured temperatures went through several large up and down shifts in the 40’s and 50’s solely because ships were switching how they took sea surface temperatures (engine inlet sampling tends to yield higher temperatures than bucket sampling).  Additionally, most surface temperature readings are taken in cities that have experienced rapid industrial growth, increasing urban heat biases in the measurements.  In effect, they have plugged and tweaked their way to the wrong target numbers!  Since the GISS and other measurement bodies are constantly revising past temperature numbers with new correction algorithms, it will be interesting to see if the climate models magically revise themselves and backcast perfectly to the new numbers as well.

Another Climate Report Written Backwards

I simply do not have the time to plow through the entire NOAA/NASA CCSP climate change report, so I focused on the 28-page section labeled Global Climate Change.

I will post my comments when they are done, but suffice it to say that this is yet another report written backwards, with the guts of the report written by politicians trying to push an agenda.  This is an incredibly shallow document, more shallow even than the IPCC report and possibly even than the IPCC summary for policy makers.  Call it the NASA summary for the mentally retarded. 

The report is a full-force sales piece for catastrophic global warming.  Not once in the entire chapter I read was there a hint of doubt or uncertainty.  Topics for which scientists have but the flimsiest of understandings, for example feedback effects, are treated with the certainty of Newtonian mechanics.  Any bit of conflicting evidence — whether it be the fact that oceans were rising before the industrial era, or that tropospheric temperatures are not higher than surface temperatures as predicted, or that large parts of Antarctica are gaining ice — are blissfully omitted. 

Many of the most important propositions in the report are stated without proof or citation.  Bill Kovacs wrote the other day that of the 21 papers that were cited, only 8 are available to the public prior to the August 14 deadline for public comment.  Just like with the IPCC, the summary is written months ahead of the science.  Much of the report seems to be cut-and-pasted from other sources  (you can tell, be graphs are reproduced exactly as they appear in other reports, such as the IPCC fourth assessment).  In many cases, the data between these various charts do not agree (for example, their charts have three or four different versions of 20th century global temperatures, none of which are either sourced or consistent). 

And, of course, the hockey stick, the Freddy Krueger of scientific analysis, is brought back yet again from the dead.

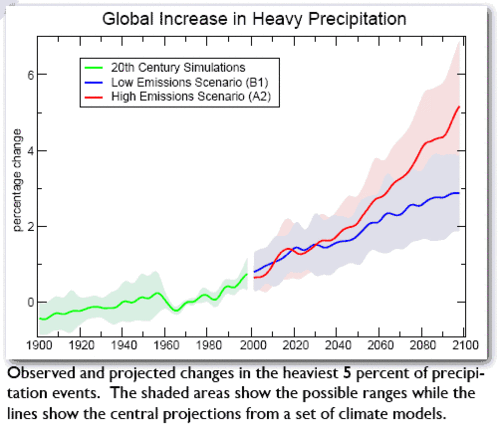
Let me give you just one taste of the quality science here.  Here is a precipitation chart they put in on page 28:

Precip

This is like those before-and-after photo games.  Can you see the sleight of hand?  Look at the legend for the green historic line.  It says that it is based on "Simulations."  This means that someone has hypothesized a relationship between temperature and precipitation (the precipitation line in this chart is tellingly nearly identical in pattern and slope to the "human + natural" temperature model output as shown at the top of page 26) and built that relationship into a model.  So the green line is a result of a) a model projecting temperature backward and b) the model taking that temperature and, based on a series of assumptions that temperature drives heavy precipitation events, generating this graph of heavy precipitation events.

Now, look at the caption.  It calls the green line "observed…changes in the heaviest 5 percent of precipitation events."  I am sorry, but model output and observations are not the same thing.  Further, note the circularity of the argument.  Models built on the assumption that temperature increases cause an increase in these events is used as proof that temperature increases these events. 

By the way, look at the error band on the green line.  For some reason, we have near perfect knowledge for worldwide precipitation events in the 1960’s, but are less certain about the 1990’s.

Practically A Summary of this Blog

In a letter of support for Lord Monckton’s recent paper in the Newsletter of the American Physical Society, APS member Roger Cohen summarized his disagreeements with the IPCC position on global warming in what could easily have been the table of contents for this blog:

I retired four years ago, and at the time of my retirement I was well convinced, as were most technically trained people, that the IPCC’s case for Anthropogenic Global Warming (AGW) is very tight. However, upon taking the time to get into the details of the science, I was appalled at how flimsy the case really is. I was also appalled at the behavior of many of those who helped produce the IPCC reports and by many of those who promote it. In particular I am referring to the arrogance; the activities aimed at shutting down debate; the outright fabrications; the mindless defense of bogus science, and the politicization of the IPCC process and the science process itself.

At this point there is little doubt that the IPCC position is seriously flawed in its central position that humanity is responsible for most of the observed warming of the last third of the 20th century, and in its projections for effects in the 21st century. Here are five key reasons for this:

  1. The recorded temperature rise is neither exceptional nor persistent. For example, the earth has not warmed since around 1997 and may in fact be in a cooling trend. Also, in particular, the Arctic and contiguous 48 states are at about the same temperature as they were in the 1930s. Also in particular the rate of global warming in the early 20th century was as great as the last third of the century, and no one seriously ascribes the early century increase to greenhouse gas emissions.
  2. Predictions of climate models are demonstrably too high, indicating a significant overestimate of the climate sensitivity (the response of the earth to increases in the incident radiation caused by atmospheric greenhouse gases). This is because the models, upon which the IPCC relies for their future projections, err in their calculations of key feedback and driving forces in the climate system.
  3. Natural effects have been and continue to be important contributors to variations in the earth’s climate, especially solar variability and decadal and multidecadal ocean cycles.
  4. The recorded land-based temperature increase data are significantly exaggerated due to widespread errors in data gathering and inadequately corrected contamination by human activity.
  5. The multitude of environmental and ecological effects blamed on climate change to date is either exaggerated or nonexistent. Examples are claims of more frequent and ferocious storms, accelerated melting of terrestrial icecaps, Mount Kilimanjaro’s glacier, polar bear populations, and expansive mosquito-borne diseases. All of these and many others have been claimed and ascribed to global warming and by extension to human activity, and all are bogus or highly exaggerated.

via Anthony Watts

A Quick Thought on “Peer Review”

One of the weird aspects of climate science is the over-emphasis on peer review as the ne plus ultra guarantor of believable results.  This is absurd.  At best, peer review is a screen for whether a study is worthy of occupying limited publication space, not for whether it is correct.  Peer review, again at best, focuses on whether a study has some minimum level of rigor and coherence and whether it offers up findings that are new or somehow advance the ball on an important topic. 

In "big boy sciences" like physics, study findings are not considered vetted simply because they are peer-reviewed.  They are vetted only after numerous other scientists have been able to replicate the results, or have at least failed to tear the original results down.  Often, this vetting process is undertaken by people who may even be openly hostile to the original study group.  For some reason, climate scientists cry foul when this occurs in their profession, but mathematicians and physicists accept it, because they know that findings need to be able to survive the scrutiny of enemies, not just of friends.  To this end, an important part of peer review is to make sure the publication of the study includes all the detail on methodology and data that others might need to replicate the results  (which is something climate reviewers are particularly bad at).

In fact, there are good arguments to be made that strong peer review may even be counter-productive to scientific advancement.  The reason is that peer review, by the nature of human beings and the incentives they tend to have, is often inherently conservative.  Studies that produce results the community expects often receive only cursory scrutiny doled out by insiders chummy with the authors.  Studies that show wildly unexpected results sometimes have trouble getting published at all.

Poscscript:  As I read this, it strikes me that one way to describe climate is that it acts like a social science, like sociology or gender studies, rather than like a physical science.  I will ahve to think about this — it would be an interesting hypothesis to expand on in more depth.  Some quick parallels of why I think it is more like a social science:

  • Bad statistical methodology  (a hallmark, unfortunately, of much of social science)
  • Emphasis on peer review over replication
  • Reliance on computer models rather than observation
  • Belief there is a "right" answer for society with subsequent bias to study results towards that answer  (example, and another example)

Climate Alarmists and Individual Rights

I am not sure this even needs comment:  (HT:  Maggies Farm)

I’m preparing a paper for an upcoming conference on this, so please comment if you can! Thanks. Many people have urged for there to be some legal or moral consequence for denying climate change. This urge generally comes from a number of places. Foremost is the belief that the science of anthropogenic climate change is proven beyond reasonable doubt and that climate change is an ethical issue. Those quotes from Mahorasy’s blog are interesting. I’ll include one here:

Perhaps there is a case for making climate change denial an offence. It is a crime against humanity, after all. –Margo Kingston, 21 November 2005

The urge also comes from frustration with a ‘denial’ lobby: the furthest and more extreme talkers on the subject who call global warming a ‘hoax’ (following James Inhofe’s now infamous quote). Of course there would be frustration with this position–a ‘hoax’ is purposeful and immoral. And those who either conduct the science or trust the science do not enjoy being told they are perpetrating a ‘hoax’, generating a myth, or committing a fraud….

I’m an advocate for something stronger. Call it regulation, law, or influence. Whatever name we give it, it should not be seen as regulation vs. freedom, but as a balancing of different freedoms. In the same way that to enjoy the freedom of a car you need insurance to protect the freedom of other drivers and pedestrians; in the same way that you enjoy the freedom to publish your views, you need a regulatory code to ensure the freedoms of those who can either disagree with or disprove your views. Either way. While I dislike Brendan O’Neill and know he’s wrong, I can’t stop him. But we need a body with teeth to be able to say, “actually Brendan, you can’t publish that unless you can prove it.” A body which can also say to me, and to James Hansen, and to the IPCC, the same….

What do you think? Perhaps a starting point is a draft point in the codes for governing how the media represent climate change, and a method for enforcing that code. And that code needs to extend out to cover new media, including blogs. And perhaps taking a lesson from the Obama campaign’s micro-response strategy: a team empowered with responding to complaints specifically dealing with online inaccuracy, to which all press and blogs have to respond. And so whatever Jennifer Mahorasy, or Wattsupwiththat, or Tom Nelson, or Climate Sceptic, or OnEarth, or La Marguerite, or the Sans Pretence, or DeSmog Blog, or Monckton or me, say, then we’re all bound by the same freedoms of publishing.

He asked for comments.  I really did not have much energy to refute something so wrong-headed, but I left a few thoughts:

Wow, as proprietor of Climate-Skeptic.com, I am sure flattered to be listed as one of the first up against the wall come the great green-fascist revolution.  I found it particularly ironic that you linked my post skewering a climate alarmist for claiming that heavier objects fall faster than lighter objects.  Gee, I thought the fact that objects of different masses fall at the same rate had been "settled science" since the late 1500s.

But I don’t think you need a lecture on science, you need a lecture on civics.  Everyone always wants free speech for themselves.  The tough part is to support free speech for others, even if they are horribly, terribly wrong-headed.  That is the miracle of the first amendment, that we have stuck by this principle for over 200 years.

You see, technocrats like yourself are always assuming the perfect government official with perfect knowledge and perfect incentives to administer your little censorship body.  But the fact is, such groups are populated with real people, and eventually, the odds are they will be populated by knaves.  And even if folks are well-intentioned, incentives kill such government efforts every time.  What if, for example, your speech regulation bureaucrats felt that their job security depended on a continued climate crisis, and evidence of no crisis might cause their job to go away?  Would they really be unbiased with such an incentive?

Here is a parallel example to consider.  It strikes me that the laws of economics are better understood than the activity of greenhouse gasses.  I wonder if the author would support limits on speech for supporters of such things like minimum wages and trade protectionism that economists routinely say make no sense in the science of economics.  Should Barrack Obama be enjoined from discussing his gasoline rebate plan because most all economists say that it won’t work the way he says?  There is an economist consensus, should that be enough to silence Obama?

5% Chance? No Freaking Way

Via William Biggs, Paul Krugman is quoting a study that says there is a 5% chance man’s CO2 will raise temperatures 10C and a 1% chance man will raise global temperatures by 20 Celsius.  The study he quotes gets these results by applying various statistical tests to the outcomes from the IPCC climate models.

I am calling Bullshit.

There are any number of problems with the Weitzman study that is the basis for these numbers, but I will address just two.

The more uncertain the models, the more certain the need for action?

The first problem is in looking at the tail end (e.g. the last 1 or 5 percent) of a distribution of outcomes for which we don’t really know the mean and certainly don’t know the standard deviation.  In fact, the very uncertainty in the modeling and lack of understanding of the values of the most basic assumptions in the models creates an enormous standard deviation.  As a result, the confidence intervals are going to be huge, such that about every imaginable value may be within them. 

In most sciences, outsiders would use the fact of these very wide confidence intervals to deride the findings, arguing that the models were close to meaningless and they would be reluctant to make policy decisions based on these iffy findings.  Weitzman, however, uses this ridiculously wide range of potential projections and total lack of certainty to increase the pressure to take policy steps based on the models, by cleverly taking advantage of the absurdly wide confidence intervals to argue that the tail way out there to the right spells catastrophe.  By this argument, the worse the models and the more potential errors that exist, then the wider the distribution of outcomes and therefore the greater the risk and need for government action.  The less we understand anthropogenic warming, the more vital it is that we take immediate, economy-destroying action to combat it.  Following this argument to its limit, the risks we know nothing about are the ones we need to spend the absolute most money on.  By this logic, the space aliens we know nothing about out there pose an astronomical threat that justifies immediate application of 100% of the world’s GDP to space defenses. 

My second argument is simpler:  Looking at the data, there is just no freaking way. 

In the charts below, I have given climate alarmists every break.  I have used the most drastic CO2 forecast (A2) from the IPCC fourth assessment, and run the numbers for a peak concentration around 800ppm.  I have used the IPCC’s own formula for the effect of CO2 on temperatures without feedback  (Temperature Increase = F(C2) – F(C1) where F(c)=Ln (1+1.2c+0.005c^2 +0.0000014c^3) and c is the concentration in ppm).  Note that skeptics believe that both the 800ppm assumption and the IPCC formula above overstate warming and CO2 buildup, but as you will see, it is not going to matter.

The other formula we need is the feedback formula.  Feedback multiplies the temperature increase from CO2 alone by a factor F, such that F=1/(1-f), where f is the percentage of the original forcing that shows up as first order feedback gain (or damping if negative).

The graph below shows various cases of temperature increase vs. CO2 concentration, based on different assumptions about the physics of the climate system.  All are indexed to equal zero at the pre-industrial CO2 concentration of about 280ppm.

So, the blue line below is the temperature increase vs. CO2 concentration without feedback, using the IPCC formula mentioned above.  The pink is the same formula but with 60% positive feedback (1/[1-.6] = a 2.5 multiplier), and is approximately equal to the IPCC mean for case A2.  The purple line is with 75% positive feedback, and corresponds to the IPCC high-side temperature increase for case A2.  The orange and red lines represent higher positive feedbacks, and correspond to the 10C 5% case and 20C 1% case in Weitzman’s article.  Some of this is simplified, but in all important respects it is by-the-book based on IPCC assumptions.

Agwforecast1

OK, so what does this tell us?  Well, we can do something interesting with this chart.   We have actually moved part-way to the right on this chart, as CO2 today is now at 385ppm, up from the pre-industrial 280ppm.  As you can see, I have drawn this on the chart below.  We have also seen some temperature increase from CO2, though no one really knows what the increase due to CO2 has been vs. the increase due to the sun or other factors.  But the number really can’t be much higher than 0.6C, which is about the total warming we have recorded in the last century, and may more likely be closer to 0.3C.  I have drawn these two values on the chart below as well.

Agwforecast2

Again, there is some uncertainty in a key number (e.g. the amount of historic warming due to CO2) but you can see that it really doesn’t matter.  For any conceivable range of past temperature increases due to the CO2 increase from 280-385 ppm, the numbers are no where near, not even within an order of magnitude, of what one would expect to have seen if the assumptions behind the other lines were correct.  For example, if we were really heading to a 10C increase at 800ppm, we would have expected temperatures to have risen in the last 100 years by about 4C, which NO ONE thinks is even remotely the case.  And if there is zero chance historic warming from man-made CO2 is anywhere near 4C, then there is zero (not 5%, not 1%) chance future warming will hit 10C or 20C.

In fact, experience to date seems to imply that warming has been under even the no feedback case.  This should not surprise anyone in the physical sciences.  A warming line on this chart below the no feedback line would imply negative feedback or damping in the climate system.  And, in fact, most long term stable physical systems are dominated by such negative feedback and not by positive feedback.  In fact, it is hard to find many natural processes except for perhaps nuclear fission that are driven by positive feedbacks as high as one must assume to get the 10 and 20C warming cases.  In short, these cases are absurd, and we should be looking closely at whether even the IPCC mean case is overstated as well.

What climate alarmists will argue is that these curves are not continuous.  They believe that there is some point out there where the feedback fraction goes above 100%, and thus the gain goes infinite, and the temperature runs away suddenly.  The best example is fissionable material being relatively inert until it reaches critical mass, when a runaway nuclear fission reaction occurs. 

I hope all reasonable people see the problem with this.  The earth, on any number of occasions, has been hotter and/or had higher CO2 concentrations, and there is no evidence of this tipping point effect ever having occurred.  In fact, climate alarmists like Michael Mann contradict themselves by arguing (in the infamous hockey stick chart) that temperatures absent mankind have been incredibly stable for thousands of years, despite numerous forcings like volcanoes and the Maunder Minimum.  Systems this stable cannot reasonably be dominated by high positive feedbacks, much less tipping points and runaway processes.

Postscript:  I have simplified away lag effects and masking effects, like aerosol cooling.  Lag effects of 10-15 years barely change this analysis at all.  And aerosol cooling, given its limited area of effect (cooling aerosols are short-lived and so are geographically limited in area downwind of industrial areas) is unlikely to be masking more than a tenth or two of warming, if any.  The video below addresses all these issues in more depth, and provides more step-by-step descriptions of how the charts above were created

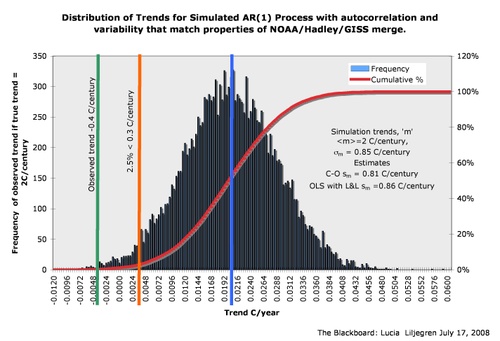
Update:  Lucia Liljegren of the Blackboard has created a distribution of the warming forecasts from numerous climate models and model runs used by the IPCC, with "weather noise" similar to what we have seen over the last few decades overlaid on the model mean 2C/century trend. The conclusion is that our experience in the last century is unlikely to be solely due to weather noise masking the long-term trend.  It looks like even the IPCC models, which are well below the 10C or 20C warming forecasts disused above, may themselves be too high.  (click for larger version)

Trendhistogramipccjune2008

While Weitzman was looking at a different type of distribution, it is still interesting to observe that while alarmists are worried about what might happen out to the right at the 95% or 99% confidence intervals of models, the world seems to be operating way over to the left.

It’s CO2, Because We Can’t Think of Anything Else it Could Be

For a while, I have written about the bizarre assumption made by climate scientists.  They cannot prove or show any good link historically between CO2 and warming.  What they instead do is show that they can’t explain some of the warming by understood processes, so they assume that any warming they cannot explain is from CO2.   Don’t believe me?

Researchers are trying to understand how much of the melting is due to the extreme natural variability in the northern polar climate system and how much is due to global warming caused by humans. The Arctic Oscillation climate pattern, which plays a big part in the weather patterns in the northern hemisphere, has been in "positive" mode in recent decades bringing higher temperatures to the Arctic.

Dr Igor Polyakov, an oceanographer from the International Arctic Research Centre in Fairbanks, Alaska, explained that natural variability as well as global warming is crucial to understanding the ice melt. "A combination of these two forces led to what we observe now and we should not ignore either forces" he said.

The consensus among scientists is that while the natural variability in the Arctic is an important contributor to climate change there, the climate models cannot explain the rapid loss of sea ice without including "human-induced" global warming. This means human activity such as burning fossil fuels and land clearing which are releasing greenhouse gases in the atmosphere.

"There have been numerous models run that have looked at that and basically they can’t reproduce the ice loss we’ve had with natural variability," said Dr Perovich. "You have to add a carbon dioxide warming component to it."

In other words, any warming scientists can’t explain is chalked up to, without proof mind you, CO2.  Why?  Well, perhaps because it is CO2 that gets the funding, so CO2 it is.  To show you how dangerous this assumption is, I note that this study apparently did not consider the effect of man-made soot from inefficient coal and oil combustion (e.g. from China).  Soot lands on the ice, lowers its albedo, and causes it to melt a lot faster.  Several recent studies have hypothesized that this alternate anthropogenic effect (with a very different solution set from Co2 abatement) may explain much of recent Arctic ice loss. 

Here is a big fat clue for climate scientists:  It is not part of the scientific method to confidently ascribe your pet theory (and source of funding) to every phenomenon you cannot explain.  Or, maybe climate scientists are on to something.  Why does gravity seem to work instantaneously at long distances? Co2!  What causes cancer cells to turn on and grow out of control?  CO2!  Hey, its easy.  All of our scientific dilemmas are instantly solved.

More on “the Splice”

I have written that it is sometimes necesary to splice data gathered from different sources, say when I suggested splicing satellite temperature measurements onto surface temperature records.

When I did so, I cautioned that there can be issues with such splices.  In particular, one needs to be very, very careful not to make too much of an inflextion in the slope of the data that occurs right at the splice.  Reasonable scientific minds would wonder if that inflection point was an artifact of the changes in data source and measurement technology, rather than in the underlying phenomenon being measured.  Of course, climate sceintists are not reasonable, and so they declare catastrophic anthropogenic global warming to be settled science based on an inflection in temperature data right at a data source splice (between tree rings and thermometers).  More here.

Absoutely Priceless Example of How Poor Alarmists’ Science Can Be

This is absolutely amazing.  I was checking out this article in the Ithaca Journal called "Climate Change 101: Positive Feedback Cycles" based on a pointer from Tom Nelson.

The Journal is right to focus on feedback.  As I have written on numerous occasions, the base effects of CO2 even in the IPCC projections is minimal.  Only by assuming unbelievably high positive feedback numbers does the IPCC and other climate modelers get catastrophic warming forecasts.  Such an assumption is hard to swallow – very few (like, zero) long-term stable natural processes (like climate) are dominated by high positive feedbacks (the IPCC forecasts assume 67-80% feedback factors, leading to forecasts 3x to 5x higher). 

So I guess I have to give kudos to an alarmist article that actually attempts to take on the feedback issue, the most critical, and shakiest, of the climate model assumptions. 

But all their credibility falls apart from the first paragraph.  They begin:

Our world is full of positive feedback cycles, and so is our society.
Popular children’s books like “If You Give a Mouse a Cookie” by Laura
Numeroff are excellent examples. In Numeroff’s tale, a mouse asks for a
cookie, leading it to ask for a glass of milk, and so on, till finally
it asks for another cookie.

Oh my God, they go to a children’s book to prove positive feedback?  If I had gone this route, I probably would have played the "sorcerer’s apprentice" card from Fantasia.  Anyway, they do soon get into real physics in the next paragraph.  Sort of.

Here’s an example everyone in Ithaca can relate to: the snowball. If
you make a small snowball and set it on the top of a hill, what
happens? 1) It begins rolling, and 2) it collects snow as it rolls.
When it collects snow, the snowball becomes heavier, which causes
gravity to pull on it with more force, making the snowball roll faster
down the hill. This causes more snow to collect on the snowball faster,
etc., etc. Get the picture? That is a positive feedback cycle.

OMG, my head is hurting.  Is there a single entry-level physics student who doesn’t know this is wrong?  The speed of a ball rolling downhill (wind resistance ignored) is absolutely unaffected by its weight.  A 10 pound ball would reach the bottom at the same moment as a 100 pound ball.  Do I really need to be lectured by someone who does not understand even the most basic of Newtonian physics.  (I would have to think about what increasing diameter would do to a ball rolling downhill and its speed — but the author’s argument is about weight, not size, so this is irrelevant."

Do you really need any more?  This guy has already disqualified himself from lecturing to us about physical processes.  But lets get a bit more:

And what happens to the snowball? Eventually the hill flattens and the
ball comes to a stop. But if the hill continued forever, the snowball
would reach some critical threshold. It would become too big to hold
itself together at the raging speed it was traveling down the hill and
it would fall apart. Before the snowball formed, it was at equilibrium
with its surroundings, and after it falls apart, it may again reach an
equilibrium, but the journey is fast-paced and unpredictable.

Two problems:  1) In nature, "hills" are never infinitely long.  And any hills that are infinitely long with minimal starting energy would find everything at the bottom of the hill long before we came into being 12 billion years or so into the history of the universe.  2)  Climate is a long-term quite stable process.  It oscillates some, but never runs away.  Temperatures in the past have already been many degrees higher and lower than they are today.  If a degree or so is all it takes to start the climate snowball running down the infinite hill, then the climate should have already run down this hill in the past, but it never has.  That is because long-term stable natural processes are generally dominated by negative, not positive, feedback. [ed: fixed this, had it backwards]

The author goes on to discuss a couple of well-known possible positive feedback factors – increases in water vapor and ice albedo.  But it completely fails to mention well-understood negative feedback factors, including cloud formation.  In fact, though most climate models assume positive feedback from the net of water processes (water vapor increase and cloud formation), in fact the IPCC admits we don’t even know the net sign of these factors.  And most recent published work on feedback factors have demonstrated that climate does not seem to be dominated by positive feedback factors.

It hardly goes without saying that an author who begins with a children’s book and a flawed physics example can’t take credit for being very scientific.  But perhaps his worst failing of all is discussing a process that has counter-veiling forces butfails to even mention half of these forces that don’t support his case.  It’s not science, it’s propaganda.

CO2 Limits Most Harmful to Low-Income Minorities

The Environmental Justice and Climate Change Initiative has issued a report that rising temperatures, supposedly from CO2, will hurt American blacks the most.

Blacks are more likely to be hurt by global warming than other Americans, according to a report issued Thursday.

The
report was authored by the Environmental Justice and Climate Change
Initiative, a climate justice advocacy group, and Redefining Progress,
a nonprofit policy institute. It detailed various aspects of climate
change, such as air pollution and rising temperatures, which it said
disproportionately affect blacks, minorities and low-income communities
in terms of poor health and economic loss.

“Right now we have
an opportunity to see climate change in a different light; to see it
for what it is, a human rights issue on a dangerous collision course of
race and class,” said Nia Robinson, director of the Environmental
Justice and Climate Change Initiative. “While it’s an issue that
affects all of us, like many other social justice issues, it is
disproportionately affecting African-Americans, other people of color,
low-income people and indigenous communities.”

Heat-related
deaths among blacks occur at a 150 to 200 percent greater rate than for
non-Hispanic whites, the report said. It also reported that asthma,
which has a strong correlation to air pollution, affects blacks at a 36
percent higher rate of incidence than whites.

Existing
disparities between low-income communities and wealthier ones, such as
high unemployment rates, are exacerbated by such negative effects of
climate change as storms and floods, the report said.

Hmm, no mention of reductions in cold-related deaths, which typically are larger in a given year than heat-related deaths.  But a more serious issue is the CO2-abatement measures this advocacy group supports.  These abatement efforts could easily increase gas prices by as much as $20 a gallon, along with similar increases in electricity and natural gas prices.  In addition, strong CO2 abatement programs are likely to knock a percent or two off economic growth rates and, if ethanol is still a preferred tactic, will likely substantially raise food prices as well.  I am no expert, but I would say that rising gas, electricity, and food prices and falling economic growth are all likely to hit low-income minorities pretty hard. 

CO2 abatement is a wealthy persons cause.  The poor of America and the world at large will be demonstrably worse off in a world that is cooler but poorer.

No Detectable Hurricane Trend

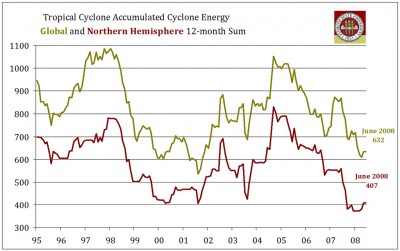
Hurricanes offer a difficult data set to work with.  Since there are so few, even small numerical changes year over year can lead to substantial percentage changes.  Also, random variations in landfall can change at least media perceptions of hurricane frequency.  That is why I have argued for a while that metrics like total cyclonic energy are better for looking at hurricane trends.  And, as you can see below, there has been no positive trend over the last 15 years or so:

Tc_ace_thumb

The Australian National Climate Center confirmed these findings:

Concern about the enhanced greenhouse effect affecting TC frequency
and intensity has grown over recent decades. Recently, trends in global
TC activity for the period 1970 to 2004 have been examined by Webster
et al. [2005]. They concluded that no global trend has yet emerged in the total number of tropical storms and hurricanes."…  For the 1981/82 to 2005/06 TC seasons, there are no apparent trends in the total numbers and cyclone days of TCs, nor in numbers and cyclone days of severe TCs with minimum central pressure of 970 hPa or lower.

Media Rorschach Test

This will come as no surprise to folks who attempt to follow climate science through the media, but a recent study really sheds some interesting light on how the media report science based on their pre-conceived notions, and not on the science itself.  Alex Tabarrok discusses media reporting on the relative math skills of men and women.  The politically correct view is that there are no differences, so it seems that was going to be the way the new science was reported, whether the data matched or not:

For the past week or so the newspapers have been trumpeting a new study
showing no difference in average math ability between males and
females.  Few people who have looked at the data thought that there
were big differences in average ability but many media reports also
said that the study showed no differences in high ability.

The LA Times, for example, wrote:

The study also undermined the assumption — infamously espoused by
former Harvard University President Lawrence H. Summers in 2005 — that
boys are more likely than girls to be math geniuses.

Scientific American said:

So the team checked out the most gifted children. Again, no difference.
From any angle, girls measured up to boys. Still, there’s a lack of
women in the highest levels of professional math, engineering and
physics. Some have said that’s because of an innate difference in math
ability. But the new research shows that that explanation just doesn’t
add up.

The Chronicle of Higher Education said:

The research team also studied if there were gender discrepancies at
the highest levels of mathematical ability and how well boys and girls
resolved complex problems. Again they found no significant differences.

All of these reports and many more like them are false.  In fact, consistent with many earlier studies
(JSTOR), what this study found was that the ratio of male to female
variance in ability was positive and significant, in other words we can
expect that there will be more math geniuses and more dullards, among
males than among females.  I quote from the study (VR is variance
ratio):

Greater male variance is indicated by VR > 1.0. All VRs, by state and grade, are >1.0 [range 1.11 to 1.21].

Notice
that the greater male variance is observable in the earliest data,
grade 2.  (In addition, higher male VRS have been noted for over a
century).  Now the study authors clearly wanted to downplay this
finding so they wrote things like "our analyses show greater male
variability, although the discrepancy in variances is not large."
Which is true in some sense but the point is that small differences in
variance can make for big differences in outcome at the top.  The
authors acknowledge this with the following:

If a
particular specialty required mathematical skills at the 99th
percentile, and the gender ratio is 2.0, we would expect 67% men in the
occupation and 33% women. Yet today, for example, Ph.D. programs in
engineering average only about 15% women.

Both the WSJ and economist Mark Perry get it right.

Climate: The First Post-Modernist Science?

When I was in college, we mechanical engineers had little but disdain for practitioners of the various social sciences, who seemed more focused on advancing political ideologies than conducting quality science.  Apparently, denizens of these softer sciences have become convinced that the lack of objectivity or objective research that plagues their fields is par for the course in the hard sciences as well.  MaxedOutMamma describes this post-modernist view of science:

If some reader is not familiar with the full-bodied modern explications of post-modernism, the story of the Dartmouth professor who decided to sue her students will serve as an introduction. Here is her version of the problem with her students. Here is an article
she wrote about working as a post-doc researcher at Dartmouth Medical
School, which may give a hint as to why her students were so, ah,
unwilling to assent to her view of the world:

In
graduate school, I was inculcated in the tenets of a field known as
science studies, which teaches that scientific knowledge has suspect
access to truth and that science is motivated by politics and human
interest.
This is known as social constructivism and is the
reigning mantra in science studies, which considers historical and
sociological understandings of science. From the vantage point of
social constructivism, scientific facts are not discovered but rather
created within a social framework. In other words, scientific facts do not correspond to a natural reality but conform to a social construct.


Lab
:
As a practicing scientist, I feel these views need to be qualified in
the context of literary inquiry. My mentor, Chris Lowrey, is an
extraordinary physician- scientist whose vision of science is pragmatic
and positivist. My experience in his
lab has shown me that the practice of science is at least partly
motivated by the scientific method, though with some qualifications.


Through my experience in the laboratory, I have found that postmodernism
offers a constructive critique of science in ways that social
constructivism cannot, due to postmodernism’s emphasis on openly
addressing the presupposed moral aims of science.
In other
words, I find that while an individual ethic of motivation exists, and
indeed guides the conduct of laboratory routine, I have also observed
that a moral framework—one in which
the social implications of science and technology are addressed—is
clearly absent in scientific settings.
Yet I believe such a framework is necessary. Postmodernism
maintains that it is within the rhetorical apparatus of science—how
scientists talk about their work—that these moral aims of science may
be accomplished.

For
those of you who cling to scientific method, this is pretty bizarre
stuff. But she, and many others, are dead serious about it. If a
research finding could harm a class of persons, the theory is that
scientists should change the way they talk about that finding. Since scientific method is a way of building a body of knowledge based on skeptical testing, replication, and publication, this is a problem.

The tight framework of scientific method mandates figuring out what would disprove the theory being tested and then looking for the disproof.
The thought process that spawned the scientific revolution was
inherently skeptical, which is why disciples of scientific method say
that no theory can be definitively and absolutely proved, but only
disproved (falsified). Hypotheses are elevated to the status of
theories largely as a result of continued failures to disprove the
theory and continued conformity of experimentation and observation with
the theory, and such efforts should be conducted by diverse parties.

Needless to say postmodernist schools of thought and scientific method are almost polar opposites.

Reading this, I start to come to the conclusion that climate scientists are attempting to make Climate the first post-modernist physical science.  It certainly would explain why climate is so far short of being a "big-boy science" like physics, where replicating results is more important than casual review of publications by a cherry-picked group of peers.  It also explains  this quote from National Center for Atmospheric Research (NOAA) climate researcher and global warming action promoter, Steven Schneider:

We
have to offer up scary scenarios, make simplified, dramatic statements,
and make little mention of any doubts we have. Each of us has to decide
what the right balance is between being effective and being honest.

Additionally, it goes a long way to explaining why Steve McIntyre gets this response when he requests the data he needs to try to replicate certain climate studies (and here):

    We have 25 or so years invested in the work. Why should I make the data available to you, when your aim is to try and find something wrong with it. There is IPR to consider.