All posts by admin

Lindzen & Choi

In preparing for my climate presentation in Phoenix next week, I went back and read through Lindzen & Choi, a study whose results I linked here.  The study claims to have measured feedback, and have found feedback to temperature changes in the natural climate system to be negative –opposite of the assumption of strong positive feedback in climate models.  I found this interesting, as we often do of studies that confirm our own hypotheses.

Re-reading the study, I was uncomfortable with the methodology, but figured I was missing something.  Specifically, I didn’t understand how an increase in temperature could result in a decrease in outgoing radiation, as Lindzen says is assumed in all the models.   As I have always understood it, the opposite has to be true in a stable system.   With an added forcing, temperature increases which increases outgoing radiation until the radiation budget is back in balance.  Models that assumed otherwise would have near infinite temepratures.   I assumed perhaps that Lindzen & Choi were making measurements during the time the system came back into equilibrium.

Apparently, both Luboš Motl and Roy Spencer have spotted problems as well, and they explain the issue in a more sophisticated way here and here.

But the results I have been getting from the fully coupled ocean-atmosphere (CMIP) model runs that the IPCC depends upon for their global warming predictions do NOT show what Lindzen and Choi found in the AMIP model runs. While the authors found decreases in radiation loss with short-term temperature increases, I find that the CMIP models exhibit an INCREASE in radiative loss with short term warming.

In fact, a radiation increase MUST exist for the climate system to be stable, at least in the long term. Even though some of the CMIP models produce a lot of global warming, all of them are still stable in this regard, with net increases in lost radiation with warming (NOTE: If analyzing the transient CMIP runs where CO2 is increased over long periods of time, one must first remove that radiative forcing in order to see the increase in radiative loss).

So, while I tend to agree with the Lindzen and Choi position that the real climate system is much less sensitive than the IPCC climate models suggest, it is not clear to me that their results actually demonstrate this.

Spencer further makes the point he has made for a couple of years now that feedback is really, really, really hard to measure, because it is so easy to confuse cause and effect.

Spencer by the way points out this admission from the Fourth IPCC report:

A number of diagnostic tests have been proposed…but few of them have been applied to a majority of the models currently in use. Moreover, it is not yet clear which tests are critical for constraining future projections (of warming). Consequently, a set of model metrics that might be used to narrow the range of plausible climate change feedbacks and climate sensitivity has yet to be developed.

This is kind of amazing, in effect saying “we have no idea what the feedbacks are or how to measure them, but lacking any knowlege, we are going to consistently and universally assume very high positive feedbacks with feedback factors > 0.7”

Regression Abuse

As I write this, I realize I go a long time without getting to climate.  Stick with me, there is an important climate point.

The process goes by a number of names, but multi-variate regression is a mathematical technique (really only made practical by computer processing power) of determining a numerical relationship between one output variable and one or more other input variables.

Regression is absolutely blind to the real world — it only knows numbers.  What do I mean by this?  Take the famous example of Washington Redskins football and presidential elections:

For nearly three quarters of a century, the Redskins have successfully predicted the outcome of each and every presidential election. It all began in 1933 when the Boston Braves changed their name to the Redskins, and since that time, the result of the team’s final home game before the election has always correctly picked who will lead the nation for the next four years.

And the formula is simple. If the Redskins win, the incumbent wins. If the Redskins lose, the challenger takes office.

Plug all of this into a regression and it would show a direct, predictive correlation between Redskins football and Presidential winners, with a high degree of certainty.  But we denizens of the real world would know that this is insane.  A meaningless coincidence with absolutely no predictive power.

You won’t often find me whipping out nuggets from my time at the Harvard Business School, because I have not always found a lot of that program to be relevant to my day-to-day business experience.  But one thing I do remember is my managerial economics teacher hammering us over and over with one caveat to regression analysis:

Don’t use regression analysis to go on fishing expeditions.  Include only the variables you have real-world evidence really affect the output variable to which you are regressing.

Let’s say one wanted to model the historic behavior of Exxon stock.  One approach would be to plug in a thousand or so variables that we could find in economics data bases and crank the model up and just see what comes out.  This is a fishing expedition.  With that many variables, by the math, you are almost bound to get a good fit (one characteristic of regressions is that adding an additional variable, no matter how irrelevant, always improves the fit).   And the odds are high you will end up with relationships to variables that look strong but are only coincidental, like the Redskins and elections.

Instead, I was taught to be thoughtful.  Interest rates, oil prices, gold prices, and value of the dollar are all sensible inputs to Exxon stock price.  But at this point my professor would have a further caveat.  He would say that one needs to have an expectation of the sign of the relationship.  In other words, I should have a theory in advance not just that oil prices affect Exxon stock price, but whether we expect higher oil prices to increase or decrease Exxon stock price.   In this he was echoing my freshman physics professor, who used to always say in the lab — if you are uncertain about the sign of a relationship, then you don’t really understand the process at all.

So lets say we ran the Exxon stock price model expecting higher oil prices to increase Exxon stock price, and our regression result actually showed the opposite, a strong relationship but with the opposite sign – higher oil prices seem to correlate better with lower Exxon stock price.  So do we just accept this finding?  Do we go out and bet a fortune on it tomorrow?  I sure wouldn’t.

No, what we do instead is take this as sign that we don’t know enough and need to research more.  Maybe my initial assumption was right, but my data is corrupt.  Maybe I was right about the relationship, but in the study period some other more powerful variable was dominating  (example – oil prices might have increased during the 1929 stock market crash, but all the oil company stocks were going down for other reasons).  It might be there is no relation between oil prices and Exxon stock prices.  Or it might be I was wrong, that in fact Exxon is dominated by refining and marketing rather than oil production and actually is worse off with higher oil prices.    But all of this points to needed research – I am not going to write an article immediately after my regression results pop out and say “New Study: Exxon stock prices vary inversely with oil prices” without doing more work to study what is going on.

Which brings us to climate (finally!) and temperature proxies.  We obviously did not have accurate thermometers measuring temperature in the year 1200, but we would still like to know something about temperatures.  One way to do this is to look at certain physical phenomenon, particularly natural processes that result in some sort of annual layers, and try to infer things from these layers.  Tree rings are the most common example – tree ring widths can be related to temperature and precipitation and other climate variables, so that by measuring tree ring widths (each of which can be matched to a specific year) we can infer things about climate in past years.

There are problems with tree rings for temperature measurement (not the least of which is that more things than just temperature affect ring width) so scientists search for other “proxies” of temperature.  One such proxy are lake sediments in certain northern lakes, which are layered like tree rings.  Scientists had a theory that the amount of organic matter in a sediment layer was related to the amount of growth activity in that year, which in term increased with temperature  (It is always ironic to me that climate scientists who talk about global warming catastrophe rely on increased growth and life in proxies to measure higher temperature).  Because more organic matter reduces x-ray density of samples, an inverse relationship between X-ray density and temperature could be formulated — in this case we will look at the Tiljander study of lake sediments.   Here is one core result:

picture1

The yellow band with lower X-ray density (meaning higher temperatures by the way the proxy is understood) corresponds pretty well with the Medieval Warm Period that is fairly well documented, at least in Europe (this proxy is from Finland).  The big drop in modern times is thought by most (including the original study authors) to be corrupted data, where modern agriculture has disrupted the sediments and what flows into the lake, eliminating its usefulness as a meaningful proxy.  It doesn’t mean that temperatures have dropped lately in the area.

But now the interesting part.  Michael Mann, among others, used this proxy series (despite the well-know corruption) among a number of others in an attempt to model the last thousand years or so of global temperature history.   To simplify what is in fact more complicated, his models regress each proxy series like this against measured temperatures over the last 100 years or so.  But look at the last 100 years on this graph.  Measured temperatures are going up, so his regression locked onto this proxy and … flipped the sign.  In effect, it reversed the proxy.  As far as his models are concerned, this proxy is averaged in with values of the opposite sign, like this:

picture2

A number of folks, particularly Steve McIntyre, have called Mann on this, saying that he can’t flip the proxy upside down.  Mann’s response is that the regression doesn’t care about the sign, and that its all in the math.

Hopefully, after our background exposition, you see the problem.  Mann started with a theory that more organic material in lake sediments (as shown by lower x-ray densities) correlated with higher temperatures.  But his regression showed the opposite relationship — and he just accepted this, presumably because it yielded the hockey stick shape he wanted.  But there is absolutely no physical theory as to why our historic understanding of organic matter deposition in lakes should be reversed, and Mann has not even bothered to provide one.  In fact, he says he doesn’t even need to.

This mistake (fraud?) is even more egregious because it is clear that the jump in x-ray values in recent years is due to a spurious signal and corruption of the data.  Mann’s algorithm is locking into meaningless noise, and converting it into a “signal” that there is a hockey stick shape to the proxy data.

As McIntyre concludes:

In Mann et al 2008, there is a truly remarkable example of opportunistic after-the-fact sign selection, which, in addition, beautifully illustrates the concept of spurious regression, a concept that seems to baffle signal mining paleoclimatologists.

Postscript: If you want an even more absurd example of this data-mining phenomenon, look no further than Steig’s study of Antarctic temperatures.   In the case of proxies, it is possible (though unlikely) that we might really reverse our understanding of how the proxy works based on the regression results. But in Steig, they were taking individual temperature station locations and creating a relationship between them to a synthesized continental temperature number.  Steig used regression techniques to weight various thermometers in rolling up the continental measure.  But five of the weights were negative!!
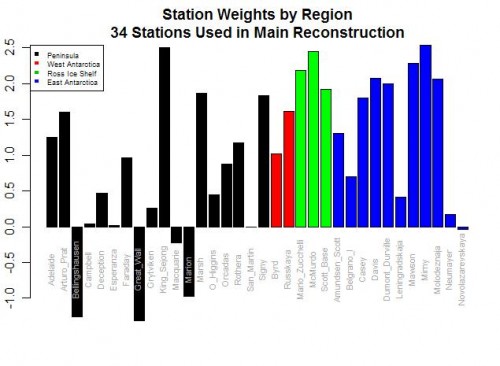
bar-plot-station-weights

As I wrote then,

Do you see the problem?  Five stations actually have negative weights!  Basically, this means that in rolling up these stations, these five thermometers were used upside down!  Increases in these temperatures in these stations cause the reconstructed continental average to decrease, and vice versa.  Of course, this makes zero sense, and is a great example of scientists wallowing in the numbers and forgetting they are supposed to have a physical reality.  Michael Mann has been quoted as saying the multi-variable regression analysis doesn’t care as to the orientation (positive or negative) of the correlation.  This is literally true, but what he forgets is that while the math may not care, Nature does.

Katrina Victims Have Standing To Sue Over Global Warming

From the WSJ:

The suit was brought by landowners in Mississippi, who claim that oil and coal companies emitted greenhouse gasses that contributed to global warming that, in turn, caused a rise in sea levels, adding to Hurricane Katrina’s ferocity. (See photo of Bay St. Louis, Miss., after the storm.)

For a nice overview of the ruling, and its significance in the climate change battle, check out this blog post by J. Russell Jackson, a Skadden Arps partner who specializes in mass tort litigation. The post likens the Katrina plaintiffs’ claims, which set out a chain of causation, to the litigation equivalent of “Six Degrees of Kevin Bacon.”

The central question before the Fifth Circuit was whether the plaintiffs had standing, or whether they could demonstrate that their injuries were “fairly traceable” to the defendant’s actions. The defendants predictably assert that the link is “too attenuated.”

But the Fifth Circuit held that at this preliminary stage in the litigation, the plaintiffs had sufficiently detailed their claims to earn a day in court.

The Green Hell Blog wrote:

I can’t wait to hear the plaintiffs argument as to why U.S. CO2 emissions versus Chinese were the proximate cause of the damage..

I would add that it will be interesting to see how oil companies will be held at fault rather than their customers who actually burned the oil and created the CO2.

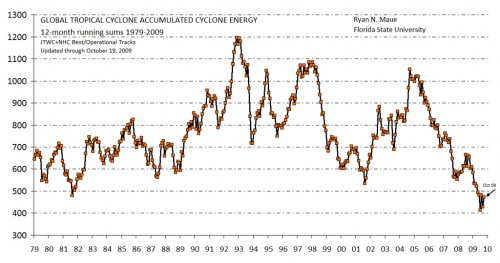
It will also be interesting to see plaintiffs explain this graph of accumulated cyclone energy in the light of their theory that man-made global warming is increasing hurricane strengths and frequencies  (ACE is a sort of integration of hurricane and tropical storm strengths over time).  (from here via WUWT)

ace

Reminder: November 10 Phoenix Climate Presentation

I am making this reminder in honor of Blog Action Day for Climate.

I would like to invite all of you in the Phoenix area to my climate presentation on November 10, 2009. The presentation is timed to coincide with the Copenhagen climate negotiations as Ill as debate on the Boxer cap-and-trade bill in the US Senate.

Despite the explosion of media stories on climate, it is difficult for the average person to really get a handle on the science of greenhouse gasses and climate change in the simplistic and often incomplete or even incorrect popular accounts. This presentation, which is free to the public, will focus on the science of climate change, including:

  • Why greenhouse gasses like CO2 warm the Earth.
  • How most forecasts of warming from manmade causes are grossly exaggerated, which helps to explain why actual temperatures are undershooting warming forecasts
  • How natural processes lead to climate variations that are being falsely interpreted as man-made.
  • A discussion of public policy initiatives, and the presentation of a much lower-cost alternative to current cap-and-trade bills
  • A review of the role of amateurs in weather and climate measurement, and how the average person can get involved

I have a degree in mechanical and aerospace engineering from Princeton University and a masters degree from Harvard. Most of his training is in control theory and the forecasting of complex dynamic systems, which turn out to be the key failure points in most catastrophic climate forecasts. My mission over the last few years both at this web site and my lectures and debates has been to teach the science of global warming in ways that are accessible to the general public.

Over the years I have preferred a debate format, as for example in my debate with Joe Nation, the author of California’s cap-and-trade law. Unfortunately, the most alarmist proponents of catastrophic manmade global warming have taken Al Gore’s lead and refuse to participate in public debates on the topic. As a result, I will do my best to be fair in presenting the global warming case, and then show which portions are really “settled science” and which portions are exaggerated. You are encouraged to check out Climate-Skeptic.com to see the type of issues I take on – there are links to past presentations, blog posts, books, and even a series of popular and highly-rated YouTube videos.

Below you will also find an example of the types of issues I will discuss. There are many, many folks out there on both sides of this issue whose writing and presentations amount to little more than fevered finger-pointing – I work hard to avoid this type rhetoric and focus on the science.

The presentation will be at 7PM November 10 in the auditorium of the Phoenix Country Day School, just north of Camelback on 40th Street, and is free to the public (this event is paid for me personally and is not sponsored or paid for by any group). The presentation will be about an hour long with another hour for questions and discussion. Folks on all sides of these issues are encouraged to attend and participate in civil discussion of the issues.

If you are interested, please join the mailing list for this presentation to receive reminders and updates:


Example Climate Issue: Positive Feedback

By Warren Meyer

I often make a wager with my audiences. I will bet them that unless they are regular readers of the science-based climate sites, I can tell them something absolutely fundamental about global warming theory they have never heard. What I tell them is this:

Man-made global warming theory is not one theory but in fact two totally separate theories chained together. These two theories are:

  1. Man-made greenhouse gasses, such as CO2, acting alone will warm the planet betIen 1.0 and 1.5 degrees Celsius by the year 2100.
  2. The Earth’s climate system is dominated by positive feedbacks, such that the warming from Greenhouse gasses alone is amplified 3-5 or more times. Most of the warming in catastrophic forecasts comes from this second effect, not directly from greenhouse gas warming.

This is not some Iird skeptic’s fantasy. This two-part description of catastrophic global warming theory is right out of the latest IPCC report. Most of the warming in the report’s forecasts actually results from the theory of positive feedback in #2, not from greenhouse gasses directly.

One of the most confusing issues for average people watching the climate debate is how one side can argue so adamantly that the science is “settled” and the other can argue just the opposite. The explanation lies in large part with this two-part theory. There is a high degree of consensus around proposition1, even among skeptics. I may disagree that the warming is 0.8C or 1.2C, but few on the science end of the debate would argue that CO2 has no effect on warming. When people say “the science is settled” they generally want to talk about proposition 1 and avoid discussion of proposition 2.

That is because proposition 2 is far from settled. The notion that a long-term stable system can be dominated by very high positive feedbacks offends the intuition of many natural scientists, who know that most natural processes (short of nuclear fission) are dominated by negative feedbacks. Sure, there are positive feedbacks in climate, just as there are negative feedbacks. The key is how these net out. The direct evidence that the Earth’s climate is dominated by strong net positive feedbacks is at best equivocal, and in fact evidence is growing that negative feedbacks may dominate, thus greatly reducing expected future warming from greenhouse gasses.

In my public presentations, I typically will

  • Explain this split of catastrophic man-made global warming theory into two propositions, and how most of the predicted catastrophe comes from the second proposition rather than the first
  • Show how skeptics have hurt their credibility by trying to challenge proposition #1
  • Explain the mechanics in simple terms of positive and negative feedback
  • Show the data and evidence related to feedback
  • Show from historic temperature numbers that assumptions of high positive feedback are extremely unlikely to be correct.

I have a video related to these issues of feedback and forecasts on YouTube in a 9 minute video titled “Don’t Panic – Flaws in Catastrophic Global Warming Forecasts.” See all my videos at my YouTube channel.

My Climate Plan

Apparently this is Blog Action Day for Climate.  The site encourages posts today on climate that will be aggregated, uh, somehow.  Its pretty clear they want alarmist posts and that the site is leftish in orientation (you just have to look at the issues you can check off that interest you — lots of things like “societal entrepreneurship” but nothing on individual liberty or checks on government power).  However, they did not explicitly say “no skeptics” — they just want climate posts.  So I will take the opportunity today to post a number of blasts from the past, including some old-old ones on Coyote Blog.

From the comments of this post, which wondered why Americans are so opposed to the climate bill when Europeans seem to want even more regulation.  Leaving out the difference in subservience to authority between Europeans and Americans, I wrote this in the comments:

I will just say:   Because it’s a bad bill. And not because it is unnecessary, though I would tend to argue that way, but for the same reason that people don’t like the health care bill – its a big freaking expensive mess that doesn’t even clearly solve the problem it sets out to attack. Somehow, on climate change, the House has crafted a bill that both is expensive, cumbersome, and does little to really reduce CO2 emissions. All it does successfully is subsidize a bunch of questionable schemes whose investors have good lobbyists.

If you really want to pass a bill, toss the mess in the House out. Do this:

  1. Implement a carbon tax on fuels. It would need to be high, probably in the range of dollars and not cents per gallon of gas to achieve kinds of reductions that global warming alarmists think are necessary. This is made palatable by the next step….
  2. Cut payroll taxes by an amount to offset the revenue from #1. Make the whole plan revenue neutral.
  3. Reevaluate tax levels every 4 years, and increase if necessary to hit scientifically determined targets for CO2 production.

Done. Advantages:

  1. no loopholes, no exceptions, no lobbyists, no pork. Keep the legislation under a hundred pages.
  2. Congress lets individuals decide how best to reduce Co2 by steadily increasing the price of carbon. Price signals rather than command and control or bureaucrats do the work. Most liberty-conserving solution
  3. Progressives are happy – one regressive tax increase is offset by reduction of another regressive tax
  4. Unemployed are happy – the cost of employing people goes down
  5. Conservatives are happy – no net tax increase
  6. Climate skeptics are mostly happy — the cost of the insurance policy against climate change that we suspect is unnecessary is never-the-less made very cheap. I would be willing to accept it on that basis.
  7. You lose the good feelings of having hard CO2 targets, but if there is anything European cap-and-trade experiments have taught, good feelings is all you get. Hard limits are an illusion. Raise the price of carbon based fuels, people will conserve more and seek substitutes.
  8. People will freak at higher gas prices, but if cap and trade is going to work, gas prices must rise by an equal amount. Legislators need to develop a spine and stop trying to hide the tax.
  9. Much, much easier to administer. Already is infrastructure in place to collect fuel excise taxes. The cap and trade bureaucracy would be huge, not to mention the cost to individuals and businesses of a lot of stupid new reporting requirements.
  10. Gore used to back this, before he took on the job of managing billions of investments in carbon trading firms whose net worth depends on a complex and politically manipulable cap and trade and offset schemes rather than a simple carbon tax.

Payroll taxes are basically a sales tax on labor.  I am fairly indifferent in substituting one sales tax for another, and would support this shift, particularly if it heads of much more expensive and dangerous legislation.

Update: Left out plan plank #4:  Streamline regulatory approval process for nuclear reactors.

The Single Best Reason Not To Fear a Climate Catastrophe

Apparently this is Blog Action Day for Climate.  The site encourages posts today on climate that will be aggregated, uh, somehow.  Its pretty clear they want alarmist posts and that the site is leftish in orientation (you just have to look at the issues you can check off that interest you — lots of things like “societal entrepreneurship” but nothing on individual liberty or checks on government power).  However, they did not explicitly say “no skeptics” — they just want climate posts.  So I will take the opportunity today to post a number of blasts from the past, including some old-old ones on Coyote Blog.

While the science of how CO2 and other greenhouse gases cause warming is fairly well understood, this core process only results in limited, nuisance levels of global warming. Catastrophic warming forecasts depend on added elements, particularly the assumption that the climate is dominated by strong positive feedbacks, where the science is MUCH weaker. This video explores these issues and explains why most catastrophic warming forecasts are probably greatly exaggerated.


You can also access the YouTube video here, or you can access a higher quality version on Google video here.

If you have the bandwidth, you can download a much higher quality version by right-clicking either of the links below:

I am not sure why the quicktime version is so porky.  In addition, the sound is not great in the quicktime version, so use the windows media wmv files if you can.  I will try to reprocess it tonight.  All of these files for download are much more readable than the YouTube version (memo to self:  use larger font next time!)

Followup on Antarctic Melt Rates

I got an email today in response to this post that allows me to cover some ground I wanted to cover.  A number of commenters are citing this paragraph from Tedesco and Monaghan as evidence that I and others are somehow mischaracterizing the results of the study:

“Negative melting anomalies observed in recent years do not contradict recently published results on surface temperature trends over Antarctica [e.g., Steig et al., 2009]. The time period used for those studies extends back to the 1950’s, well beyond 1980, and the largest temperature increases are found during winter and spring rather than summer, and are generally limited to West Antarctica and the Antarctic Peninsula. Summer SAM trends have increased since the 1970s [Marshall, 2003], suppressing warming over much of Antarctica during the satellite melt record [Turner et al., 2005]. Moreover, melting and surface temperature are not necessarily linearly related because the entire surface energy balance must be considered [Liston and Winther, 2005; Torinesi et al., 2003].”

First, the point of the original post was not about somehow falsifying global warming, but about the asymmetry in press coverage to emerging data.  It is in fact staggeringly unlikely that I would use claims of increasing ice buildup in Antarctica as “proof” that anthropogenic global warming theory as outlined, say, by the fourth IPCC report, is falsified.  This is because the models in the fourth IPCC report actually predict increasing snowmass in Antarctica under global warming.

Of course, the study was not exactly increasing ice mass, but decreasing ice melting rates, which should be more correlated with temperatures.  Which brings us to the quote above.
I see a lot of studies in climate that seem to have results that falsify some portion of AGW theory but which throw in acknowledgments of the truth and beauty of catastrophic anthropogenic global warming theory in the final paragraphs that almost contradict their study results, much like natural philosophers in past centuries would put in boiler plate in their writing to protect them from the ire of the Catholic Church.   One way to interpret this statement is “I know you are not going to like these findings but I am still loyal to the Cause so please don’t revoke by AGW decoder ring.”

This particular statement by the authors is hilarious in one way.  Their stated defense is that Steig’s period was longer and thus not comparable.  The don’t outright say it, but they kind of beat around the bush at it, that the real issue is not the study length, but that most of the warming in Steig’s 50-year period was actually in the first 20 yearsThis is in fact something we skeptics have been saying since Steig was released, but was not forthrightly acknowledged in Steig.   Here is some work that has been done to deconstruct the numbers in Steig.  Don’t worry about the cases with different numbers of “PCs”, these are just sensitivities with different geographic regionalizations.  Basically, under any set of replication approaches to Steig, all the warming is in the first 2 decades.

Reconstruction

1957 to 2006 trend

1957 to 1979 trend (pre-AWS)

1980 to 2006 trend (AWS era)

Steig 3 PC

+0.14 deg C./decade

+0.17 deg C./decade

-0.06 deg C./decade

New 7 PC

+0.11 deg C./decade

+0.25 deg C./decade

-0.20 deg C./decade

New 7 PC weighted

+0.09 deg C./decade

+0.22 deg C./decade

-0.20 deg C./decade

New 7 PC wgtd imputed cells

+0.08 deg C./decade

+0.22 deg C./decade

-0.21 deg C./decade

Now, knowing this, here is Steig’s synopsis:

Assessments of Antarctic temperature change have emphasized the contrast between strong warming of the Antarctic Peninsula and slight cooling of the Antarctic continental interior in recent decades1. This pattern of temperature change has been attributed to the increased strength of the circumpolar westerlies, largely in response to changes in stratospheric ozone2. This picture, however, is substantially incomplete owing to the sparseness and short duration of the observations. Here we show that significant warming extends well beyond the Antarctic Peninsula to cover most of West Antarctica, an area of warming much larger than previously reported. West Antarctic warming exceeds 0.1 °C per decade over the past 50 years, and is strongest in winter and spring. Although this is partly offset by autumn cooling in East Antarctica, the continent-wide average near-surface temperature trend is positive. Simulations using a general circulation model reproduce the essential features of the spatial pattern and the long-term trend, and we suggest that neither can be attributed directly to increases in the strength of the westerlies. Instead, regional changes in atmospheric circulation and associated changes in sea surface temperature and sea ice are required to explain the enhanced warming in West Antarctica.

Wow – don’t see much acknowledgment that all the warming trend was before 1980.   They find the space to recognize seasonal differences but not the fact that all the warming they found was in the first 40% of their study period?   (And all of the above is not even to get into the huge flaws in the Steig methodology, which purports to deemphasize the Antarctic Peninsula but still does not)

This is where the semantic games of trying to keep the science consistent with a political position get to be a problem.  If Steig et al had just said “Antarctica warmed from 1957 to 1979 and then has cooled since,” which is what their data showed, then the authors of this new study would not have been in a quandary.  In that alternate universe, of course decreased ice melt since 1980 makes sense, because Steig said it was cooler.  But because the illusion must be maintained that Steig showed a warming trend that continues to this date, these guys must deal with the fact that their study agrees with the data in Steig, but not the public conclusions drawn from Steig.  And thus they have to jump through some semantic hoops.

Telling Half the Story 100% of the Time

By now, I think most readers of this site have seen the asymmetry in reporting of changes in sea ice extent between the Arctic and the Antarctic.  On the exact same day in 2007 that seemingly every paper on the planet was reporting that Arctic sea ice extent was at an “all-time” low, it turns out that Antarctic sea ice extent was at an “all-time” high.  I put “all-time” in quotes because both were based on satellite measurements that began in 1979, so buy “all-time” newspapers meant not the 5 billion year history of earth or the 250,000 year history of man or the 5000 year history of civilization but instead the 28 year history of space measurement.  Oh, that “all time”.

It turns out there is a parallel story with land-based ice and snow.  First some background

As most folks know, melting sea ice has no effect on world ocean heights — only melting of ice on land affects sea levels.   This land-based ice is distributed approximately as follows:

Antarctica:  89%

Greenland: 10%

Glaciers around the world: 1%

I won’t go into glaciers, in part because their effect is small, but suffice it to say they are melting, but they have been observed melting and retreating for 200 years, which makes this phenomenon hard to square with Co2 buildups over the last 50 years.

I am also not going to talk much about Greenland.  The implication of late has been that Greenland ice is melting fast and such melting is somehow unprecedented, so that it must be due to modern man.  This is of course slightly hard to square with the historical fact of how Greenland got its name, and the fact that it was warmer a thousand years ago than it is today.

But I am sure you have heard panic and doom in innumerable articles about 11% of the world’s land ice.   But what about the other 89%.  Crickets?

This may be why you never hear anything:

From World Climate Report: Antarctic Ice Melt at Lowest Levels in Satellite Era

Where are the headlines? Where are the press releases? Where is all the attention?

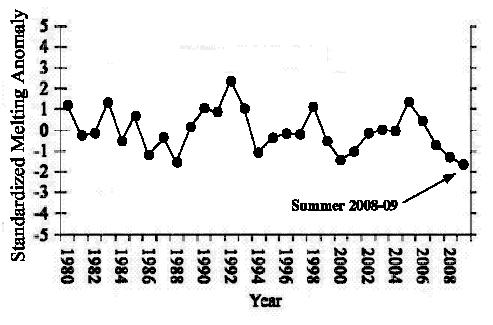
The ice melt across during the Antarctic summer (October-January) of 2008-2009 was the lowest ever recorded in the satellite history.

Such was the finding reported last week by Marco Tedesco and Andrew Monaghan in the journal Geophysical Research Letters:

A 30-year minimum Antarctic snowmelt record occurred during austral summer 2008–2009 according to spaceborne microwave observations for 1980–2009. Strong positive phases of both the El-Niño Southern Oscillation (ENSO) and the Southern Hemisphere Annular Mode (SAM) were recorded during the months leading up to and including the 2008–2009 melt season.

antarctica_icemelt

Figure 1. Standardized values of the Antarctic snow melt index (October-January) from 1980-2009 (adapted from Tedesco and Monaghan, 2009).

The silence surrounding this publication was deafening.

By the way, in case you think there may be some dueling methodologies here – ie that the scientists measuring melting in Greenland are professional real scientists while the guys doing the Antarctic work are somehow skeptic quacks, the lead author of this Antarctic study is the same guy who authored many of the Greenland melting studies that have made the press.  Same author.  Same methodology.  Same focus (on ice melting rates).  Same treatment in the press?   No way.  Publish the results only if they support the catastrophic view of global warming.

So — 11% of world’s land ice shrinking – Front page headlines.  89% of world’s land ice growing.  Silence.

UPDATE: Followup  here

Phoenix Climate Presentation, November 10 at 7PM

I have given a number of presentations on climate change around the country and have taken the skeptic side in a number of debates, but I have never done anything in my home city of Phoenix.

Therefore, I will be making a presentation in Phoenix on November 10 at 7PM in the auditorium of the Phoenix Country Day School, on 40th Street just north of Camelback. Admission is free. My presentation is about an hour and I will have an additional hour for questions, criticism, and rebuttals from the audience.

I will be posting more detail later, but the presentation will include background on global warming theory, a discussion of why climate models are likely exaggerating future warming, and an evaluation of various policy alternatives. The presentation will be heavy on science and data, but is meant to be accessible without a science background. I will post more details of the agenda as we get closer to the event.

I am taking something of a risk with this presentation. I am paying for the auditorium and promotion myself — I am not doing this under the auspices of any group. However, I would like to get good attendance, in part because I would like the media representatives attending to see the local community demonstrating interest in at least giving the skeptic side of the debate a hearing. If you are a member of a group that might like to attend, please email me directly at the email link at the top of this page and I can help get more information and updates to your group.

Finally, I have created a mailing list for folks who would like more information about this presentation – just click on the link below. All I need is your name and email address.

Some Common Sense on Treemometers

I have written a lot about historic temperature proxies based on tree rings, but it all boils down to “trees make poor thermometers.”  There are just too many things, other than temperature, that can affect annual tree growth.  Anthony Watts has a brief article from one of his commenter that discusses some of these issues in a real-life way.  This in particular struck me as a strong dose of common sense:

The bristlecone records seemed a lousy proxy, because at the altitude where they grow it is below freezing nearly every night, and daytime temperatures are only above freezing for something like 10% of the year. They live on the borderline of existence, for trees, because trees go dormant when water freezes. (As soon as it drops below freezing the sap stops dripping into the sugar maple buckets.) Therefore the bristlecone pines were dormant 90% of all days and 99% of all nights, in a sense failing to collect temperature data all that time, yet they were supposedly a very important proxy for the entire planet. To that I just muttered “bunkum.”

He has more on Briffa’s increasingly famous single hockey stick tree.

More Hockey Stick Hyjinx

Update: Keith Briffa responds to the issues discussed below here.

Sorry I am a bit late with the latest hockey stick controversy, but I actually had some work at my real job.

At this point, spending much time on the effort to discredit variations of the hockey stick analysis is a bit like spending time debunking phlogiston as the key element of combustion.  But the media still seems to treat these analyses with respect, so I guess the effort is necessary.

Quick background:  For decades the consensus view was that earth was very warm during the middle ages, got cold around the 17th century, and has been steadily warming since, to a level today probably a bit short of where we were in the Middle Ages.  This was all flipped on its head by Michael Mann, who used tree ring studies to “prove” that the Medieval warm period, despite anecdotal evidence in the historic record (e.g. the name of Greenland) never existed, and that temperatures over the last 1000 years have been remarkably stable, shooting up only in the last 50 years to 1998 which he said was likely the hottest year of the last 1000 years.  This is called the hockey stick analysis, for the shape of the curve.

Since he published the study, a number of folks, most prominently Steve McIntyre, have found flaws in the analysis.  He claimed Mann used statistical techniques that would create a hockey stick from even white noise.  Further, Mann’s methodology took numerous individual “proxies” for temperatures, only a few of which had a hockey stick shape, and averaged them in a way to emphasize the data with the hockey stick.  Further, Mann has been accused of cherry-picking — leaving out proxy studies that don’t support his conclusion.  Another problem emerged as it became clear that recent updates to his proxies were showing declining temperatures, what is called “divergence.”  This did not mean that the world was not warming, but did mean that trees may not be very good thermometers.  Climate scientists like Mann and Keith Briffa scrambled for ways to hide the divergence problem, and even truncated data when necessary.  More hereMann has even flipped the physical relationship between a proxy and temperature upside down to get the result he wanted.

Since then, the climate community has tried to make itself feel better about this analysis by doing it multiple times, including some new proxies and new types of proxies (e.g. sediments vs. tree rings).  But if one looks at the studies, one is struck by the fact that its the same 10 guys over and over, either doing new versions of these studies or reviewing their buddies studies.  Scrutiny from outside of this tiny hockey stick society is not welcome.  Any posts critical of their work are scrubbed from the comment sections of RealClimate.com (in contrast to the rich discussions that occur at McIntyre’s site or even this one) — a site has even been set up independently to archive comments deleted from Real Climate.  This is a constant theme in climate.  Check this policy out — when one side of the scientific debate allows open discussion by all comers, and the other side censors all dissent, which do you trust?

Anyway, all these studies have shared a couple of traits in common:

  • They have statistical methodologies to emphasize the hockey stick
  • They cherry pick data that will support their hypothesis
  • They refuse to archive data or make it available for replication

The some extent, the recent to-do about Briffa and the Yamal data set have all the same elements.  But this one appears to have a new one — not only are the data sets cherry-picked, but there is growing evidence that the data within a data set has been cherry picked.

Yamal is important for the following reason – remember what I said above about just a few data sets driving the whole hockey stick.  These couple of data sets are the crack cocaine to which all these scientists are addicted.  They are the active ingredient.  The various hockey stick studies may vary in their choice of proxy sets, but they all include a core of the same two or three that they know with confidence will drive the result they want, as long as they are careful not to water them down with too many other proxies.

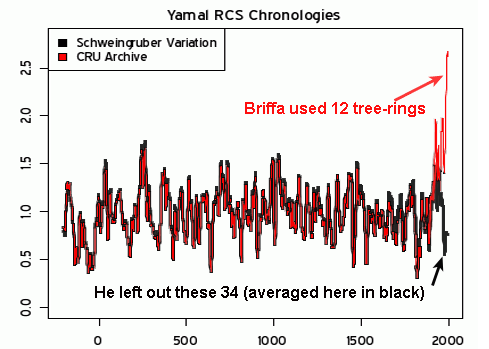
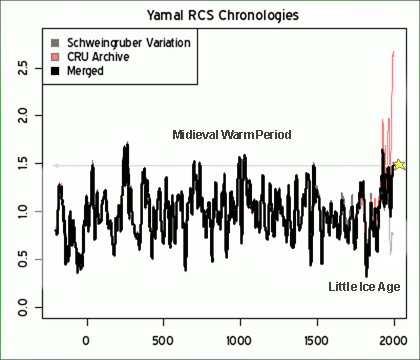
Here is McIntyre’s original post.   For some reason, the data set Briffa uses falls off to ridiculously few samples in recent years (exactly when you would expect more).  Not coincidentally, the hockey stick appears exactly as the number of data points falls towards 10 and then 5 (from 30-40).  If you want a longer, but more layman’s view, Bishop Hill blog has summarized the whole storyUpdateMore here, with lots of the links I didn’t have time this morning to find.

Postscript: When backed against the wall with no response, the Real Climate community’s ultimate response to issues like this is “Well, it doesn’t matter.”  Expect this soon.

Update: Here are the two key charts, as annotated by JoNova:

rcs_chronologies1v2

And it “matters”

yamal-mcintyre-fig2

What A Daring Guy

Joe Romm has gone on the record at Climate Progress on April 13, 2009 that the “median” forecast was for warming in the US by 2100 of 10-15F, or 5.5-8.3C, and he made it very clear that if he had to pick a single number, it would be the high end of that range.

On average, the 8.3C implies about 0.9C per decade of warming.  This might vary slightly by what starting point he intended (he is not very clear in the post) and I understand there is a curve so it will be below average in the early years and above in the later.

Anyway, Joe Romm is ready to put his money where his mouth is, and wants to make a 50/50 bet with any comers that warming in the next decade will be… 0.15C.  Boy, it sure is daring for a guy who is constantly in the press at a number around 0.9C per decade to commit to a number 6 times lower when he puts his money where his mouth is.   Especially when Romm has argued that warming in the last decade has been suppressed (somehow) and will pop back up soon.  Lucia has more reasons why this is a chickensh*t bet.

I deconstructed a previous gutless bet by Nate Silver here.

Have You Checked the Couch Cushions?

Patrick Michaels describes some of the long history of the Hadley Center and specifically Phil Jones’ resistance to third party verification of their global temperature data.  First he simply refused to share the data

We have 25 years or so invested in the work. Why should I make the data available to you, when your aim is to try and find something wrong with it?

(that’s some scientist, huh) and then he said he couldn’t share the data and now he says he’s lost the data.

Michaels gives pretty good context to the issues of station siting, but there are many other issues that are perfectly valid reasons for third parties to review the Hadley Center’s methodology.  A lot of choices have to be made in patching data holes and in giving weights to different stations and attempting to correct for station biases.  Transparency is needed for all of these methodologies and decisions.  What Jones is worried about is whenever the broader community (and particularly McIntyre and his community on his web site) have a go at such methodologies, they have always found gaping holes and biases.  Since the Hadley data is the bedrock on which rests almost everything done by the IPCC, the costs of it being found wrong are very high.

Here is an example post from the past on station siting and measurement quality.  Here is a post for this same station on correction and aggregation of station data, and problems therein.

Great Moments in Skepticism and “Settled Science”

Via Radley Balko:

The phrase shaken baby syndrome entered the pop culture lexicon in 1997, when British au pair Louise Woodward was convicted of involuntary manslaughter in the death of Massachusetts infant Matthew Eappen. At the time, the medical community almost universally agreed on the symptoms of SBS. But starting around 1999, a fringe group of SBS skeptics began growing into a powerful reform movement. The Woodward case brought additional attention to the issue, inviting new research into the legitimacy of SBS. Today, as reflected in the Edmunds case, there are significant doubts about both the diagnosis of SBS and how it’s being used in court.

In a compelling article published this month in the Washington University Law Review, DePaul University law professor Deborah Teurkheimer argues that the medical research has now shifted to the point where U.S. courts must conduct a major review of most SBS cases from the last 20 years. The problem, Teurkheimer explains, is that the presence of three symptoms in an infant victim—bleeding at the back of the eye, bleeding in the protective area of the brain, and brain swelling—have led doctors and child protective workers to immediately reach a conclusion of SBS. These symptoms have long been considered pathognomic, or exclusive, to SBS. As this line of thinking goes, if those three symptoms are present in the autopsy, then the child could only have been shaken to death.

Moreover, an SBS medical diagnosis has typically served as a legal diagnosis as well. Medical consensus previously held that these symptoms present immediately in the victim. Therefore, a diagnosis of SBS established cause of death (shaking), the identity of the killer (the person who was with the child when it died), and even the intent of the accused (the vigorous nature of the shaking established mens rea). Medical opinion was so uniform that the accused, like Edmunds, often didn’t bother questioning the science. Instead, they’d often try to establish the possibility that someone else shook the child.

But now the consensus has shifted. Where the near-unanimous opinion once held that the SBS triad of symptoms could only result from a shaking with the force equivalent of a fall from a three-story to four-story window, or a car moving at 25 mph to 40 mph (depending on the source), research completed in 2003 using lifelike infant dolls suggested that vigorous human shaking produces bleeding similar to that of only a 2-foot to 3-foot fall. Furthermore, the shaking experiments failed to produce symptoms with the severity of those typically seen in SBS deaths….
When I put all of this together, I said, my God, this is a sham,” Uscinski told Discover. “Somebody made a mistake right at the very beginning, and look at what’s come out of it.”

Before I am purposefully misunderstood, I am not committing the logical fallacy that an incorrect consensus in issue A means the consensus on issue B is incorrect.  The message instead is simple:  beware scientific “consensus,” particularly when that consensus is only a decade or two old.

Good News / Bad News for Media Science

The good news:  The AZ Republic actually published a front page story (link now fixed) on the urban heat island effect in Phoenix, and has a discussion of how changes in ground cover, vegetation, and landscaping can have substantial effects on temperatures, even over short distances.  Roger Pielke would be thrilled, as he has trouble getting even the UN IPCC to acknowledge this fact.

The bad news:  The bad news comes in three parts

  1. The whole focus of the story is staged in the context of rich-poor class warfare, as if the urban heat island effect is something the rich impose on the poor.  It is clear that without this class warfare angle, it probably would never have made the editorial cut for the paper.
  2. In putting all the blame on “the rich,” they miss the true culprit, which are leftish urban planners whose entire life goal is to increase urban densities and eliminate suburban “sprawl” and 2-acre lots.  But it is the very densities that cause the poor to live in the hottest temperatures, and it is the 2-acre lots that shelter “the rich” from the heat island effects.
  3. Not once do the authors take the opportunity to point out that such urban heat island effects are likely exaggerating our perceptions of Co2-based warming — that in fact some or much of the warming we ascribe to Co2 is actually due to this heat island effect in areas where we have measurement stations.

My son and I quantified the Phoenix urban heat island years ago in this project.

I am still wondering why Phoenix doesn’t investigate lighter street paving options.  They use all black asphalt, and just changing this approach (can you have lighter asphalt?) would be a big help.  By the way, our house is all white with a white foam roof, so we are doing our part to fight the heat island!

Ocean Acidification

In the past, I have responded to questions at talks I have given on ocean acidification with an “I don’t know.”  I hadn’t studied the theory and didn’t want to knee-jerk respond with skepticism just because the theory came from people who propounded a number of other theories I knew to be BS.

The theory is that increased atmospheric CO2 will result in increasing amounts of CO2 being dissolved .  That CO2 when in solution with water forms carbonic acid.  And that acidic water can dissolve the shells of shellfish.  They have tested this by dumping acid in sea water and doing so has had a negative effect on shellfish.

This is one of those logic chains that seems logical on its face, and is certainly scientific enough sounding to fool the typical journalist or concerned Hollywood star.  But the chemistry just doesn’t work this way.   This is the simplest explanation I have found, but I will take a shot at summarizing the key problem.

It is helpful to work backwards through this proposition.  First, what is it about acidic water  — actually not acidic, but “more neutral” water, since sea water is alkaline  — that causes harm to the shells of sea critters?   H+ ions in solution from the acid combine with calcium carbonate in the shells, removing mass from the shell and “dissolving” the shall.  When we say an acid “eats” or “etches” something, a similar reaction is occurring between H+ ion and the item being “dissolved”.

So pouring a beaker of acid into a bucket of sea water increases the free H+ ions and hurts the shells.  And if you do exactly that – put acid in seawater in an experiment – I am sure you would get exactly that result.

Now, you may be expecting me to argue that there is a lot of sea water and the net effect of trace CO2 in the atmosphere would not affect the pH much, especially since seawater starts pretty alkaline.  And I probably could argue this, but there is a better argument and I am embarrassed that I never saw it before.

Here is the key:  When CO2 dissolves in water, we are NOT adding acid to the water.  The analog of pouring acid into the water is a false one.  What we are doing is adding CO2 to the water, which combines with water molecules to form carbonic acid.  This is not the same as adding acid to the water, because the H+ ions we are worried about are already there in the water.  We are not adding any more.  In fact, one can argue that increasing the CO2 in the water “soaks up” H+ ions into carbonic acid and by doing so shifts the balance  so that in fact less calcium carbonate will be removed from shells.    As a result, as the link above cites,

As a matter of fact, calcium carbonate dissolves in alkaline seawater (pH 8.2) 15 times faster than in pure water (pH 7.0), so it is silly, meaningless nonsense to focus on pH.

Unsurprisingly, for those familiar with  climate, the chemistry of sea water is really complex and it is not entirely accurate to isolate these chemistries absent other effects, but the net finding is that CO2 induced thinning of sea shells seems to be based on a silly view of chemistry.

Am I missing something?  I am new to this area of the CO2 question, and would welcome feedback.