This is cross-posted from my non-climate blog. I wrote it for folks who spend less time on the science-based skeptic sites, but I had several folks tell me that it would still be useful to post here.
First, let’s settle something. The world has warmed since 1850. While there always is an error bar on nearly every statement about nature, I think there is little point in questioning this past warming. There is ice core data that suggests that the little ice age, which ended some time in the very early 19th century, was perhaps the coldest period, or one of the two or three coldest periods, in the last 5000 years (ie in nearly the entire span of human civilization). Temperatures are inevitably warming from this low point.(*1)
So, if the point is not to deny warming altogether, what is the point in discussions of Climategate of picking over and trying to audit historical temperature records like the Hadley CRUT3 or NASA’s GISStemp? Skeptics often argue that much of the warming is due to bogus manual adjustments in the temperature records and biases such as urban warming. Alarmists argue that the metrics may understate warming because of masking by manmade anthropogenic cooling agents (e.g. sulfate aerosols). Why bother? Why does it matter if past warming is 0.6C or 0.8C or 0.3C? There are at least two reasons.
1. The slope of recent temperature increases is used as evidence for the anthropogenic theory.
We know greenhouse gasses like CO2 have a warming effect in the lab. And we know that overall they warm planets because otherwise ours would be colder. But how much does an incremental amount of CO2 (a relatively weak greenhouse gas) warm the Earth? A lot or a little? Is the sensitivity of the climate to CO2 high or low?
Every time I try to express this, it sounds so ridiculous that people think I must have it wrong. But the main argument supporting a high climate sensitivity to CO2 is that scientists claim to have looked at past warming, particularly from 1950-2000, and they can’t think of any natural cause that could behind it, which leaves CO2 by process of elimination. Yeah, I know this seems crazy – one wants to ask if this is really a test for CO2 sensitivity or of scientists’ understanding and imagination, but there you have it.
Now, they don’t always say it this directly. What they actually say is that they ran their climate models and their climate models could not produce the warming from 1950-2000 with natural forcings alone, but could reproduce this warming with forcings from CO2. But since the climate models are not handed down from the gods, but programmed by the scientists themselves to represent their own understanding of the climate system, in effect this is just a different way of saying what I said in the previous paragraph. The climate models perform the function of scientific money laundering, taking an imperfect knowledge on the front end and somehow converting that into settled science at the output.
Now, there are a lot of ways to criticize this approach. The models tend to leave out multi-decadal ocean cycles and don’t really understand cloud formation well. Further, the period from 1957-2008, which supposedly can only be explained by non-natural forcings, has almost the exact same temperature profile and increase as the time from 1895-1946, which of necessity must be mostly “natural.” I go into this more here, among other places.
But you can see that the amount of warming matters to this argument. The more the warming falls into a documented natural range of temperature variation, the harder it is to portray it as requiring man-made forcings to explain. This is also the exact same reason alarmist scientists work so hard to eliminate the Medieval Warm Period and little ice age from the temperature record. Again, the goal is to show that natural variation is in a very narrow range, and deviations from this narrow range must therefore be man-made. (*2)
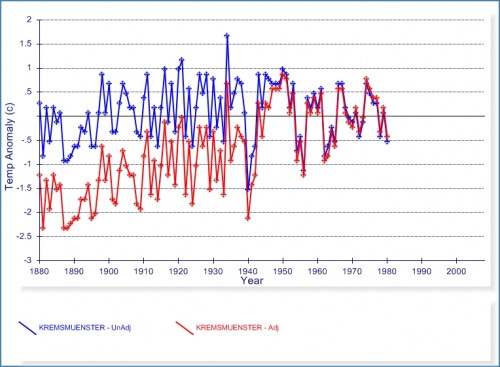
This is the sort of unified field theory of everything we are seeing in the CRU emails. We see scientists using every trick they can find to lower or smooth out temperatures numbers before 1950, and adjust numbers after 1950 upwards. Every single trick and programming adjustment all tended to have this effect, whether it be in proxy studies or in the instrumental record. And all the efforts to prevent scrutiny, ignore FOIA’s, and throw out raw data have been to avoid third party replication of the statistical methods and adjustments they used to achieve these ends.
As an aside, I think it is incorrect to picture this as a SPECTRE-like cabal scheming to do evil. These guys really, really believed they had the right answer, and these adjustments were made to tease out what they just knew the right answer to be. This is why we are only going to see confused looks from any of these guys – they really, really believed they were doing God’s work. They are never going to understand what they did wrong. Which doesn’t make it any less bad science, but just emphasizes that we are never going to get data without spin until total sunlight is brought to this process
2. It is already really hard to justify the huge sensitivities in alarmist forecasts based on past warming — if past warming is lower, forecasts look even more absurd.
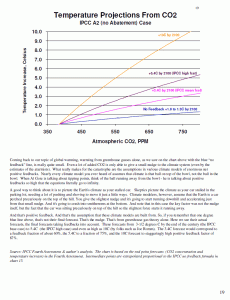
The best way to illustrate this is with a few charts from my most recent climate presentation and video. We usually see warming forecasts by year. But the real relationship is between warming and CO2 concentration (this relationship is called climate sensitivity). One can graph forecasts at various levels:

The blue line corresponds to the IPCC no-feedback formula that I think originally goes back to Michael Mann, and yields about 1-1.2C of warming for greenhouse gas warming from CO2 before feedback effects. The middle two lines correspond to the IPCC mid and high forecasts, and the top line corresponds to more alarmist forecasts from folks like Joe Romm who predict as much as 8-10C of warming by 2100 (when we will be at 650-800ppm CO2 per the IPCC). By the way, the IPCC does not publish the lines above the blue line, so I have taken the formula they give for the blue line and scaled it to meet their end points. I think this is reasonable.
A couple of things – all climate models assume net positive feedback, what skeptics consider the key flaw in catastrophic global warming theory. In fact, most of the catastrophe comes not from global warming theory, but by this second theory that the Earth’s temperature system is dominated by very high positive feedback. I illustrate this here. The blue line is from CO2 greenhouse gas warming. Everything above it is from the multiplier effects of assumed feedbacks.

I won’t go into the feedback issue much now – search my site for positive feedback or else watch my video for much more. Suffice it to say that skeptics consider the feedback issue the key failure point in catastrophic forecasts.
Anyway, beyond arguing about feedbacks, there is another way to test these forecasts. Relationships that hold for CO2 and warming in the future must hold in the past (same Earth). So lets just project these lines backwards to the CO2 level in the late 19th century.

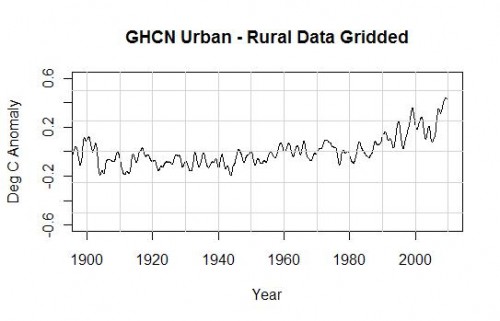
Can you see the issue? When projected back to pre-industrial CO2 levels, these future forecasts imply that we should have seen 2,3,4 or more degrees of warming over the last century, and even the flawed surface temperature records we are discussing with a number of upwards biases and questionable adjustments only shows about 0.6C.
Sure, there are some time delay issues, probably 10-15 years, as well as some potential anthropogenic cooling from aerosols, but none of this closes these tremendous gaps. Even with an exaggerated temperature history, only the no feedback 1C per century case is really validated by history. And, if one assumes the actual warming is less than 0.6C, and only a part of that is from anthropogenic CO2, then the actual warming forecast justified is one of negative feedback, showing less than 1C per century warming from manmade CO2 — which is EXACTLY the case that most skeptics make.
Those who control the past control the future. Those who control the present control the past.– George Orwell
Footnotes:
(1) More than once I have contemplated how much the fact that the invention of the thermometer occurred at perhaps the coldest point in human memory (early 17th century) has contributed to the perceptions of current warm weather being unusual.
(2) For those who are on the ball, perhaps you can spot an amazing disconnect here. Scientists claim that the natural variation of temperatures is in a very narrow band, that they never move even 0.2C per decade by natural means. But they also say that the Earth’s temperature system is dominated by positive feedback, meaning that very very small changes in forcings are magnified many fold in to large temperature changes. I won’t go in to it in depth from a systems perspective, but trust me that “high stability in a narrow range” and “dominated by high positive feedback” are not very compatible descriptions of a system.

