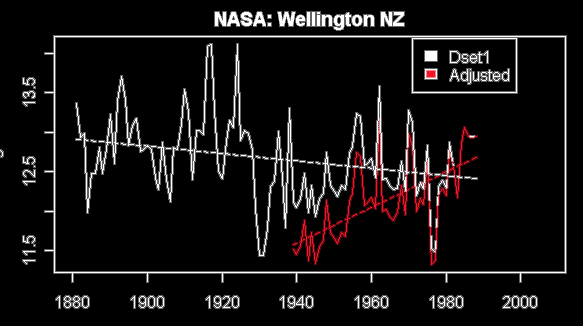
On this blog and at Coyote Blog, we have focused a lot of attention on the adjustment processes used by NOAA and James Hansen of NASA’s GISS to "correct" historical temperatures. Steve McIntyre has unearthed what looks like a simply absurd example of the lenghts Hansen and the GISS will go to tease a warming signal out of data that does not contain it.
The white line is the measured temperatures in Wellington, New Zealand before Hansen’s team got hold of the data. The red is the data that is used in the world-wide global warming numbers after Hansen had finished adjusting it. The original flat to downward trend is entirely consistent with sattelite temeprature measurement that shows the southern hemisphere not to be warming very much or at all.
What do these adjustments imply? Well, Hansen has clearly reduced temperatures down in the forties while keeping them about the same in 1980. Why? Well, the only possible reason would be if there was some kind of warming bias in 1940 in Wellington that did not exist in 1980. It implies that things like urban effects, heat retention by asphalt, and heat sources like cars and air conditioners were all more prevelent in 1940 New Zealand than in 1980. However, unless Wellington has gone through some back to nature movement I have not heard about, this is absurd. Nearly without exception, if measurement points experience changing biases in our modern world, it is upwards over time with urbanization, not downwards as implied in this chart.
Postscript: A perceptive reader might ask whether Hansen perhaps has specific information about this measurement point. Maybe its siting has improved over time? However, Hansen has to date absolutely rejected the effort made by folks like surfacestations.org to document specific biases in measurement sites via individual site surveys. Hansen is in fact proud that he makes his adjustments knowing nothing about the sites in question, but only using statistical methods (of very dubious quality) to correct using other local measurement sites.


Just like his buddy Al Gore (with the internet), Hansen has invented something…Anthroprogenic Global Warming.
His “statistical methods (of very dubious quality)” are merely arbitrary adjustments, as far as I can see: what undergraduates used rudely to call fiddle-factors or fudge-factors. Of course, undergraduates rarely reflect that if the fiddle is added or subtracted it is a “term” not a “factor”.
I think Hansen is a lying bastard
You should not expect every single site to show an adjustment that is as expected (UHI correction in recent times). A perceptive reader already pointed out on Steve’s site that the method of adjustment, corrects IN GENERAL for urbanization by comparison to nearby rural sites. Since there are some random variations, just by chance, it is possible that some urban stations may get corrected up, rather than down. This (should be) made up for by that subset of stations which are overcorrected up for random reasons. If you have a problem with THAT procedure, state it.
There seem to be two sources of different slopes:
a. The “adjustment down” in mid century (increasing, in magnitude, linearly from 1975 back to 1939).
b. The truncation of the series “back at” 1939.
Just eying it, it looks like at least half of the slope delta is from the truncation.
Understanding what elements drive truncation and what elements drive the linear (is it really, or does it just look that way?) adjustment over time, would be additive.
Also, while looking at this, one should NOT get too wrapped up in an individual station or get into promotion of a general effect, based on a single case. Look at the Y2K error. It was bimodal.