Gavin Schmidt has absolutely no evidence for this: (via Tom Nelson)
Gavin [Schmidt],
In your opinion, what percentage of global warming is due to human causes vs. natural causes?
[Response: Over the last 40 or so years, natural drivers would have caused cooling, and so the warming there has been (and some) is caused by a combination of human drivers and some degree of internal variability. I would judge the maximum amplitude of the internal variability to be roughly 0.1 deg C over that time period, and so given the warming of ~0.5 deg C, I’d say somewhere between 80 to 120% of the warming. Slightly larger range if you want a large range for the internal stuff. – gavin]
This is a complete bluff. There is no way he or anyone else knows this. I could reverse his numbers and say 0-20% for CO2 and have just as much justification (actually more, see below). We have devised no good way to parse the temperature changes into any reliable division between various drivers given the complexity of climate. The only way climate scientists claim to do it is with their highly flawed temperature models, which is a fit of hubris that is unfathomable.
But, beyond the fact that he simply can’t know the answer, his guess here is just awful. It does not reality check at all. Here are a few pointers:
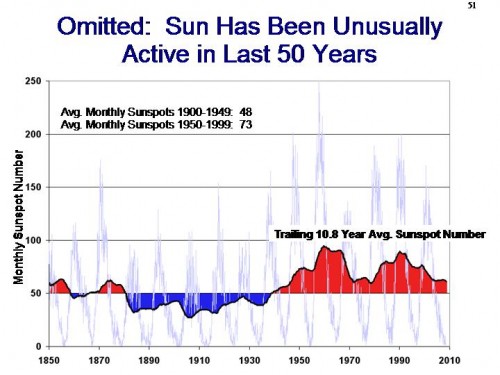
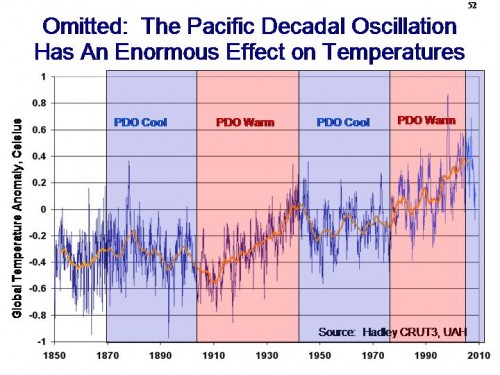
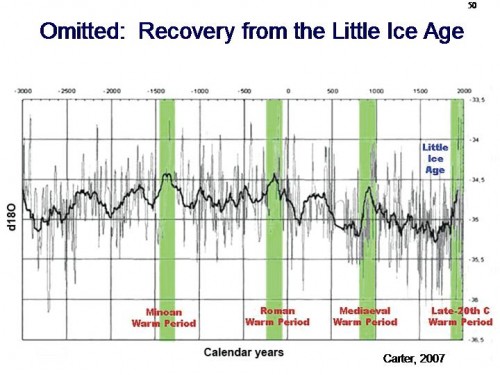
1. Over the last 40 years, or at least over the portion from 1975-1995 when we saw most of the temperature increase, the sun was at its most active this century, as measured by sunspot numbers. The PDO, which has close links to temperature, was in its warm cycle. We likely were continuing to see long-term cyclical recovery from the little ice age. And anthropogenic land use changes were increasing both urban and rural temperatures. But he claims that the net effect of non-CO2 factors would have been negative? This is roughly equivalent to Obama’s jobs claims numbers, saying that he saved jobs that would otherwise have been lost. It’s appeal is that it makes a useful political point while being impossible to prove.
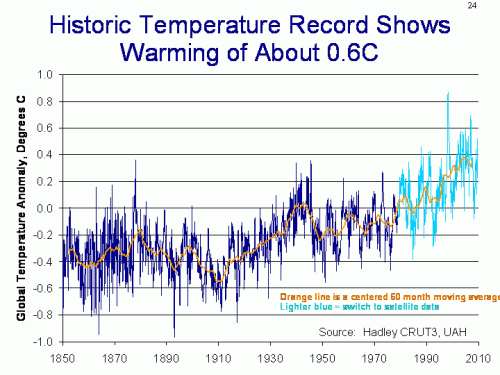
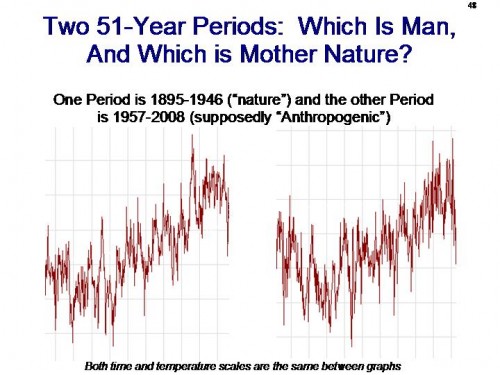
2. Hansen is basically repeating the IPCC position that there could be no possible natural explanation for the the 0.2C per decade temperature increases from 1975-2000 — ie that such a pace of temperature increase has to be due to CO2 alone (80-120% in my mind equates to CO2 alone). But world temperatures increased from 1910 to 1940 by 0.2C per decade, in a period almost certainly only minimally influenced by CO2 (see below). So natural effects can cause warming in the 1930’s but not in the 1980’s because, why?
I often use this chart with audiences:
3. I am positive that Hansen would argue that natural effects are currently (and temporarily) canceling out some of the warming. He would say this as a way to deflect criticism that the world has stopped warming over the last decade (something the CRU emails admit they don’t understand, though they won’t admit this publicly**). But Hansen et al. think we should be seeing 0.2C a decade or more in CO2 warming that is apparently being overcome by natural effects. So natural effects have enough variability to cancel out 0.2C of warming but not enough to cause 0.2C of warming? Huh?
This is sort of a special theme this week on this blog, as the topic keeps coming up. In short, climate scientists need the climate to be alternately sensitive and insensitive, unstable and stable, driven by nature and not driven by nature, all depending on the period they are trying to explain. All these wildly contradictory assumptions are required to try to keep the hypothesis of very high sensitivities to CO2 alive.
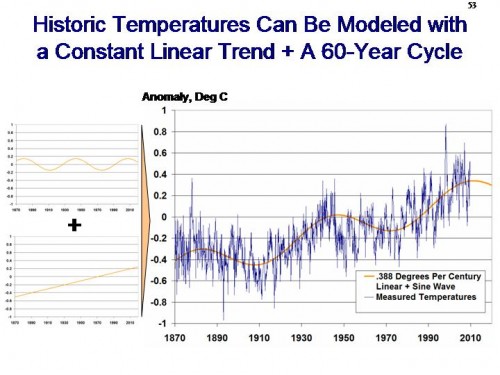
Here, by the way, was my attempt to explain the last 100 years of temperature with a cyclical wave plus a small linear trend:
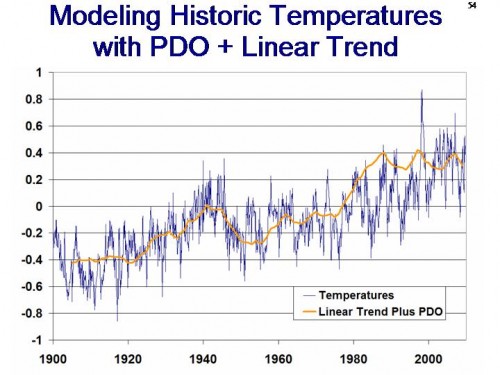
Not bad, huh? Here is a similar analysis using a linear trend plus the PDO
My answer seems at least as plausible as Gavin’s. Here is where I did this analysis in more depth. If I really had an official climate scientist decoder ring, I would blame the gap between measured temperatures and my simplified model in orange during the 1980’s on aerosols. I don’t know how much if any they affect the climate, but neither do climate scientists and that does not stop them from using it as the universal model plug to improve historic correlations.
By the way, for reference, here is the sunspot cycle:
Here is the world temperature graph overlayed with the PDO
And finally here is some evidence (from ice core analysis) that we may just still be recovering from a period that could well have been the coldest period in the last 5000 years (notice the regular millennial trend as well).
But CO2 explains 80-120% of the warming? The time is hopefully coming when smart people stop taking such statements on faith and demand proof.
**Postscript- Last year I attended a fantastic series of lectures and discussions at ASU called the Origins Conference. One thing that I observed there was the scientists, in talking about things like the origins of the universe, were quick to admit where they didn’t understand things — in fact they sort of were gleeful about it, like something that they didn’t understand was a new toy under the Christmas tree. And for real scientists, I suppose it is. This is not at all what we see in the CRU emails.

Good post.
(One nit: You keep saying Hansen. Do you mean Mann?)
Just as a mildy-ignorant devil’s advocate, could some of the increase in sunspot counts over the past 50 years be due to superior observation technology, or does this factor in at all?
I’m skeptical of the sun explanation even more than the CO2 explanation. But the history of the earth’s climate (temperature) demonstrations significant feedback effects.
I don’t think that most AGW proponents have read the work of the shadowy organization known as the “IPCC”. It clearly has a lot of heretics in it.
E.g. take a look at http://scienceofdoom.com/2009/12/03/those-hazy-skeptics-at-the-ipcc/
These crazy IPCC guys (and gals?) are telling us that they aren’t sure whether aerosols have no effect or more than enough to eliminate CO2-induced warming. And meanwhile the IPCC top dogs are saying “the science is settled”. I don’t understand. No one reads even the executive summaries anymore?
what a wonderful model. simple yet fits the recent observations as well as the historical data. this is far more compelling than any of the IPCC models.
@ Evil Red Scandi
It is conceivable that there is a tiny bias relating to technological improvements to sunspot number counts, however, this would only be for some of the very small sunspots. perfectly adequate counts could be done with a telescope and a piece of card to view the sun on.
19th century telecopes were more than capable of resolving sunspots.
There are clear ways of determining what goes into a model and what doesn’t. It is a principle component analysis.
You can determine which inputs are sigificant, which aren’t. You can look at the residual and test to see if that is random. If it is not, then you have missed an input.
I would suggest the following inputs as those to try.
1. Volcanos. It is pretty clear that Pinatobo and others have a marked effect.
2. CO2 (since that is what the argument is about)
3. Solar output. The reasoning is that it is such a large heat source that even a small variation is significant.
4. Polution. Either directly (contrails or indirectly via nucleation for clouds).
There is an interesting test just for the effect of polution. We know from volcanos that it doesn’t persist in the atmosphere. Also mixing between the hemispheres is slow. That means if polution is a coolant, then the Northern Hemisphere should show a cooling effect that is greater than the southern hemisphere. (It doesn’t)
5. Skirt lengths or any other factor
If they don’t show an effect, then the cause gets dropped.
No El Nino/ La Nina. The reason is that these are effects. It’s a cycle and that means there is autoregression in the model. ie. Past temperatures in the pacific affect future temperatures in a cyclical way.
Then you can apportion the effects and see how significant they are.
What’s interesting in the climate case, is that the models assume large feedback effects. Since CO2 has increase and temperatures have dropped, is that the divergence from the model is even more significant than one with lower forcings. The more they exagerate, the more the divergence issue proves them wrong.
I’ve a separate point on temperature records, and its a question. Something I haven’t heard discussed. Why are they so keen on stitching temperature records together? Can you get a record of the anomalies without stitching?
For example, if we have different sites, active at different times over an area. They like one record for an area so join the dots.
However, if you take two years, say 1970, 1971. Three records, A, B and C.
A runs 1950-1970. B runs 1971-2000, and C runs 1950-2000. A and B are in the same area but there is a one year gap. They go through all sorts of tricks to bridge the gap.
However, you can say for A we know the drop/increase 1950-1951, 1951-1952, … 1970-1971. Ditto for the others.
So for a give year, its just a sample of changes. Just use what you have and ignore any issue about stitching.
That means you can ignore changes of location (changes of height cause a drop)
What you can’t ignore is UHI
Nick
Gavin stopped doing science a long time ago. I don’t think he ever started doing logic.
why replace thermometer temps (dark blue) with satelite data (light blue) near the end of the first chart? Is this an attempt to hide the incline?
Actually, this is one of the few times I would agree with Gavin that humans are responsible for 80-120% of the rise in temperature. Remember who adjusted the temperatures to show the rise. He should know.
Gavin has every reason to hype his invented numbers.
it keeps the global warming hysteria bandwagon rolling and when it rolls, Gavin’s Gravy Train of funding rolls too.
To say nothing of his First Class seat in the Fame Train. These Warmists like the media attention, the flattering stories in the media etc.
In a way, I have to admire someone like you that is so willfully ignorant and insists upon maintaining their stupidity.
The facts and the reality do not support your ignorance at all. Think about the laws of physics. All energy creation and use releases heat. All energy eventually degrades into heat. So the overpopulation of the world and the ever-increasing use of energy by a larger percentage of people continues to release heat into the environment. If you cannot understand that, you are simply far too stupid to be worth considering as anyone to be taken even as a joke.
Yo! Pissoa! Climate does not run on human energy consumption, or did you miss the past billion years?
I checked out your blog. I was going to comment but I don’t wish to extend your streak of two whole comments in the entire lifetime of your blog.
Gavin Schmidt is a sophisticated, highly intellectualized evangelist of the dogma. To think of his arrogance and his cavaliernss without regards to the negative effects of his statements without any evidence and which will cause such damage to civilization comes very close to my idea of evil. I’m sorry to come to this conlusion, but this global warming cabal is devastatingly bad for human civilization.
Your chart showing two 50 year periods has the the period from the 1850’s to the end of the century labeled “nature”, the industrial revolution was well under way by the 1850’s with wood and coal burning being the primary sources of power. Frankly your statements and graphs are bullshit.
Ckerst, I think you will find that fossil fuel burning at the beginning of the industrial revolution was miniscule compared to more recent levels. I am only fifty one years old but can recall a time when (in the UK) most people did not have a car. There are some who would like to remember this as a golden age of cheap, reliable public transport but the fact is, people just didn’t go anywhere.
On the subject of the OP, no-one seems to have picked up on the fact that it is impossible to have 120% of anything. You can have a more than 100% increase on a particular figure, but the term “Per-cent” actually means parts out of a hundred and 120 parts out of 100 is a nonsense statement.
I wonder why AGW trolls have such limited vocabularies?
Does a dispute over the labeling of the periods on the graph mean the data is not valid?
Or, once again, is an AGW true believer unable to assimilate information that leads to unpleasant implication, lashing out?
Here’s Gavin’s response to my RC post on the topic:
Q: One reason CO2 is thought to be responsible for warming since 1970 since the models can’t come up with another natural cause – ie it wins by default. However, there was a similar magnitude of warming (according to the thermometer record), from say 1900-1940. It would seem that there are natural effects that could produce the magnitude of variation we have seen since the 1970’s, say .25C/decade. Further bolstering that case is the *lack* of warming over the past 10 yrs – ie that has to net out the drift assumed by CO2 warming. So at this point you have to concede that the natural variation in temperature must be around .25C/decade. Given that, the historical record is not statistically different from a 1 SD deviation from a random path over the past 100 yrs or so. (sqrt 10 * .25 C = .8 C). None of this is meant to construe that CO2 is not a warming gas ceteris paribus. Any thoughts?
[Response: Our a priori estimates of the impacts of CO2 and the other forcings on the temperature explain well what we’ve seen in recent decades. Without them, we have no explanation, none. Earlier periods are affected both by uncertainties in the forcings and in the data, and so attributions are more uncertain, but the earlier period was associated with a slight increase in solar and a period without much volcanism along with changes in CO2. There is clearly a role for internal variability in both periods, but this is not unlimited in scope. – gavin]
The problem for them, is that with their feedback numbers, they can’t replicate the temperature seen over the last years.
Given their large feedback numbers, the difference between the two is large, and its statistical significance very strong. ie. Their models don’t work
Nick
Nick – yes differencing the individual thermometers solves a lot of the problems. The issue is the silly notion of basing everything against a “base temperature” of the average of 1950-1980 or something. It’s nonsense.
I thought this was a great post. Especially the modelling with a constant trend and a 60-year cycle. I have often wondered why statisticians (and some climatologists) seem to be obsessed with fitting straight lines onto every graph. That’s not how nature generally does things. When I first saw NIWAs graph of NZ temperatures on Icecap (Are we feeling warmer yet? – 29 Nov 2009), I thought, “Looks like a sine wave to me. So we’re at the top of a natural cycle then. Nothing to see here, move along.” Then I enlarged it and saw that someone had drawn a straight line on it – starting from the lowest point (of course).
Again, great post – Thanks!
Partly it’s an incentives issue. In my career, my incentive has been to get it right. In climate scientists’ careers, the incentive has become to get it hot.
Great,great,great post !!!
You wrote:
“If I really had an official climate scientist decoder ring, I would blame the gap between measured temperatures and my simplified model in orange during the 1980’s on aerosols. I don’t know how much if any they affect the climate, but neither do climate scientists and that does not stop them from using it as the universal model plug to improve historic correlations.”
Interestingly, I posted at Real Climate the following question regarding Lindzen recent column in the WSJ and received the following response from Gavin
56. The article [by Lindzen] makes the following statement:
“So how do models with high sensitivity manage to simulate the currently small response to a forcing that is almost as large as a doubling of CO2? Jeff Kiehl notes in a 2007 article from the National Center for Atmospheric Research, the models use another quantity that the IPCC lists as poorly known (namely aerosols) to arbitrarily cancel as much greenhouse warming as needed to match the data, with each model choosing a different degree of cancellation according to the sensitivity of that model.” http://online.wsj.com/article/SB10001424052748703939404574567423917025400.html
I wonder if one of the modelers here could comment on this assertion?
[Response: There is uncertainty in both climate sensitivity and the degree of aerosol forcing (see figure 2.20). No model simulation can ‘prove’ that it has exactly the right sensitivity and aerosol forcing, but each of the simulations that match the 20th Century trends are plausible estimates of what might have happened. Projections going forward are obviously going to be a little different depending on that balance, but that is a real part of the uncertainty in those projections and shouldn’t be swept under the rug. – gavin]
I know you are busy and I will understand if you don’t want to do the extra work, but I think it would be interesting if you made a projection to the year 2100 using your linear trend plus PDO model. To keep it simple, perhaps you could assume that the PDO index for the next 100 years will be the same as the PDO for the past 100 years.
Retardfest continues.
“There is no way he or anyone else knows this”
You are appallingly ignorant; you should not assume that everyone else is. It is rather easy to estimate internal variability and put clear limits on it.
“Over the last 40 years, or at least over the portion from 1975-1995 when we saw most of the temperature increase, the sun was at its most active this century, as measured by sunspot numbers”
Wrong. All indices of solar activity have been declining since 1980 or earlier.
“The PDO, which has close links to temperature, was in its warm cycle”
There is no correlation on decadal time scales between the PDO index and global temperatures.
“We likely were continuing to see long-term cyclical recovery from the little ice age”
Warming does not cause itself. There is no concept of “recovery” in climate science.
“And anthropogenic land use changes were increasing both urban and rural temperatures”
The oceans are warming. The Arctic is warming. The Antarctic peninsula is warming.
“world temperatures increased from 1910 to 1940 by 0.2C per decade, in a period almost certainly only minimally influenced by CO2”
It’s trivial to estimate the effect of CO2 over this period. The influence was definitely not minimal. If you understand what a greenhouse effect is, you can understand why this is.
“So natural effects can cause warming in the 1930’s but not in the 1980’s because, why?”
Natural effects, obviously, can cause warming whenever they occur. If they don’t occur, there is no natural warming. If, for example, solar activity declines, or if several large volcanoes erupt.
“I am positive that Hansen would argue that natural effects are currently (and temporarily) canceling out some of the warming”
Why would he do that, when 1999-2008 has been 0.2°C warmer than 1989-1998?
“the world has stopped warming over the last decade”
And the world is flat.
“My answer seems at least as plausible as Gavin’s.”
Now that is pretty funny. Your answer is that of a retard who doesn’t understand physics. To believe that it is plausible, you’d have to be spectacularly incapable.
“we may just still be recovering from a period that could well have been the coldest period in the last 5000 years”
And still you believe that warming causes itself.
I predict that you will fail to respond to any of these points. You are clearly incapable of arguing your case.
“I am positive that Hansen would argue that natural effects are currently (and temporarily) canceling out some of the warming”
That would only be relevant if you have evidence that he was claiming real temperature were below actual because natural effects were temporarily raising temperatures. 1998 el Nino being an example
Nick
Hunter,
You lose just on your ignorance of solar:
http://www.space.com/scienceastronomy/060926_solar_activity.html
RE: internal variability: Certainly you can demonstrate just how easy it is to us feebs?
RE: PDO and temps and your assertion of no correlation:
http://www.drroyspencer.com/research-articles/global-warming-as-a-natural-response/
Oceans warming?
http://www.examiner.com/x-1586-Baltimore-Weather-Examiner~y2009m1d21-Oceans-are-cooling-according-to-Nasa
Antarctic not warming:
http://www.telegraph.co.uk/comment/columnists/christopherbooker/4332784/Despite-the-hot-air-the-Antarctic-is-not-warming-up.html
I am getting bored with how stupid you are, but I do find you are right about one thing:
http://www.alaska.net/~clund/e_djublonskopf/Flatearthsociety.htm
Fools like you do seem to believe the earth is flat.
When does clown college start back up? I am sure you have a natural like you could do well there. Best wishes,
Hunter wrote:
“There is no way he or anyone else knows this”
You are appallingly ignorant; you should not assume that everyone else is. It is rather easy to estimate internal variability and put clear limits on it.”
Obviously it is possible write computer code to constrain “internal variabiity” or “natural variations” using any arbitrary value chosen by the programmer. It also possible to “estimate” “internal variability” or “natural variations” by running a computer climate model with and without “estimated” anthropogenic forcing. That is the method described in the IPCC. This method provides an “estimate”, not an empirical measurement. If you have a better idea, please explain.
Or course, this method provides an accurate “estimate” only to the extent the climate model accurately models “natural and anthropogenic forcing, along with their feedbacks. That is the point in contention. There is little reason to believe that climate models can do this, given the unknowns openly acknowledged in the IPCC. If you disagree, please explain.
I am a skeptic, but I am open to persuasion.
Hunter spews:
Wrong. All indices of solar activity have been declining since 1980 or earlier.
Err, um, wrong: Sun’s Activity Increased in Past Century, Study Confirms. It took me all of 10 seconds to find this article at Space.com.
Money quote:
. By analyzing the amount of titanium 44, a radioactive isotope, the team found a significant increase in the Sun’s radioactive output during the 20th century.
Over the past few decades, however, they found the solar activity has stabilized at this higher-than-historic level.
Hmm. Has stabilized. Which means … has not been declining.
They try to argue that since the increase leveled in the last few decades, this can’t be the source for the measured increase in temperature at the same time. I think there could be arguments made both ways, which is fine.
But that’s really besides the point. You, Hunter, are a shitbag. You are completely incapable of discerning the truth. You are lost in a self-referential quantum loop of brain farts, which you have mistaken for deep thoughts. In the meantime, you stink up the joint, and make life generally unpleasant for the rest of us.
Go crawl back under your bridge and play with your tickle-me-elmo doll. Leave the hard thinking to the adults.
Over the past few decades, however, they found the solar activity has stabilized at this higher-than-historic level.
Hmm. Has stabilized. Which means … has not been declining.
======================
No, re-read it.
The critical part, has stabilized at higher levels. That means it has increased and is now tracking sideways
Meteorologist Art Horn: “The theory of global warming is lying on the canvas bloodied and dying.”
http://energytribune.com/articles.cfm?aid=2665
(IPCC models fail yet again.)