A lot of folks have asked me why I wasn’t more energized initially about the climate emails. One reasons is that they don’t really reveal much that I and others who did not go along blindly with the orthodoxy knew for years. The emails are kind of like getting a written confession from OJ Simpson to Nicole Brown’s murder- newsworthy, but it wouldn’t be confirming anything I didn’t already know.
Here is a good example. I wrote this November 10, 2007:
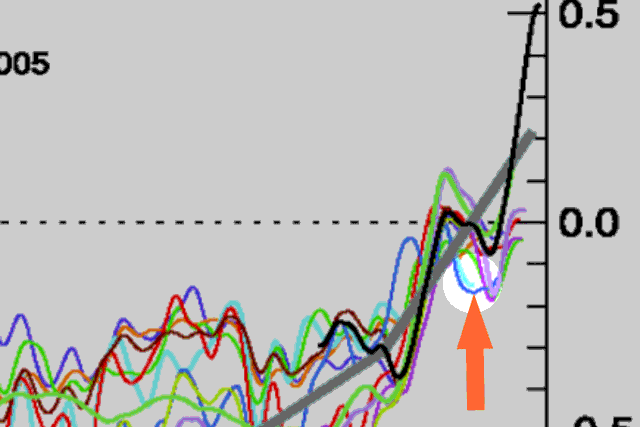
By the way, here is a little lesson about the integrity of climate science. See that light blue line [in this graph from the IPCC Fourth Assessment]? Here, let’s highlight it:
For some reason, the study’s author cut the data off around 1950. Is that where his proxy ended? No, in fact he had decades of proxy data left. However, his proxy data turned sharply downwards in 1950. Since this did not tell the story he wanted to tell, he hid the offending data by cutting off the line, choosing to conceal the problem rather than have an open scientific discussion about it.
The study’s author? Keith Briffa, who the IPCC named to lead this section of their Fourth Assessment.
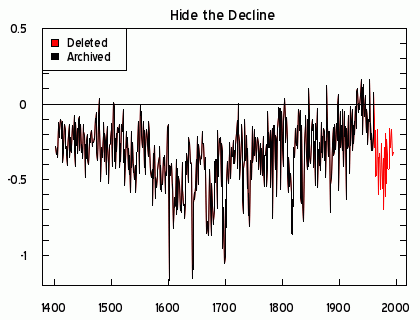
The recent data release apparently includes this chart of Briffa’s proxy data discussed above (from Steve McIntyre via Anthony Watts):
For the very first time, the Climategate Letters “archived” the deleted portion of the Briffa MXD reconstruction of “Hide the Decline” fame – see here. Gavin Schmidt claimed that the decline had been “hidden in plain sight” (see here. ). This isn’t true.
The post-1960 data was deleted from the archived version of this reconstruction at NOAA here and not shown in the corresponding figure in Briffa et al 2001. Nor was the decline shown in the IPCC 2001 graph, one that Mann, Jones, Briffa, Folland and Karl were working in the two weeks prior to the “trick” email (or for that matter in the IPCC 2007 graph, an issue that I’ll return to.)
A retrieval script follows.
For now, here is a graphic showing the deleted data in red.
Figure 1. Two versions of Briffa MXD reconstruction, showing archived and climategate versions. The relevant IPCC 2001 graph, shown below, clearly does not show the decline in the Briffa MXD reconstruction.Contrary to Gavin Schmidt’s claim that the decline is “hidden in plain sight”, the inconvenient data has simply been deleted.
I think his hockey stick looks a little flacid. Fortunately someone invented Tiljander sediments, a form of data Viagra (as long as one flips it upside down) and such games were no longer necessary.


From a textbook on dendroclimatology: “…no tree ring-based reconstructions of northern hemisphere temperatures that includes the 1990s is able to capture the range of late 20th century warming seen in the instrumental records. This means that instrumental records show warming, but reconstructed temperatures from trees show cooling or no change.” – Paleoclimates by Thomas Cronin
They don’t know why the tree rings diverge from instrumental records in the late 20th Century, but they do, so merging a graph of (the more accurate) instrumental record with the tree ring chronologies will obviously leave some hanging threads.
Possible problems with tree ring chronologies? Sure. Absolute knowledge of past temperatures from proxies? Probably not. Creating fake data to institute a socialist communist atheist marxist algore obama black helicopter illuminati area 51 chemtrail one world government? No.
Hammiesink,
Using a ridiculous strawman that unless the team is working towards a “socialist communist atheist marxist algore obama black helicopter illuminati area 51 chemtrail one world government” then no bad motvie can be attributed to the team to avoid dealing with the simple fact of fraud by the team is rather naive on your part, no?
The text book you quote shows that not one claim made using tree rings about climate is accurate.
If the tree rings are not accurate for temps now, they are not accurate for temps then, either.
The past temps probably falsely appear to coincide with tree rings, I bet, cue to tree ring use in past climate records. IOW, yet another leg of the AGW stool is shown to be self-referential and untrustworthy.
>… no bad motvie can be attributed to the team to avoid dealing with the simple fact of fraud by the team is rather naive on your part, no?
1. All across the skepticsphere, skeptics are jumping for joy that AGW is a hoax because they think “hide the decline” means the globe is really cooling and that climatologists faked the warming trend
2. Tree ring proxies diverge from the instrumental record from 1960s-1980s
3. This problem has been OPENLY discussed, not hidden, in the literature since 1998
4. When creating graphs that merge instrumental record with proxies, the divergence is clearly seen
5. For some purposes, it can help to clean up the graph by “hiding the decline” since the instrumental record is obviously far more accurate than tree ring proxies
6. Therefore, skeptic claims that scientists cooked data to create AGW are incorrect
>If the tree rings are not accurate for temps now, they are not accurate for temps then, either.
Ice cores, glacial retreat, and other proxies are all independent data sets that show similar results.
>yet another leg of the AGW stool is shown to be self-referential and untrustworthy.
So you are arguing…like this?
1. If tree ring proxies are inaccurate, then CO2 is not a greenhouse gas
2. Tree ring proxies are inaccurate
3. Therefore, CO2 is not a greenhouse gas
Or maybe like this?
1. If tree ring proxies are inaccurate, then CO2 is not increasing
2. Tree ring proxies are inaccurate
3. Therefore, CO2 is not increasing
Or perhaps this?
1. If tree ring proxies are inaccurate, then temperatures have not been rising since 1980
2. Tree ring proxies are inaccurate
3. Therefore, temperatures have not been rising since 1980
I just thought I’d point out that EIV Mann08 and the methods of Mann09, do graft the data directly on the temperature record.
Hammiesink,
I doubt anybody is saying what you claim the skeptics are saying.
The research refered to is an attempt to ‘dis-prove’ the existance of the medieval warming period by using a proxy which is so unreliable as to be meaningless. To hide the fact that the proxy is a complete dud, the authors selectively edit out bits of data and substitute instrument data. Then they pat each other on the back for having made the medieval warming period disapear as if by magic.
It’s a deception on the part of the authors and they acknowledge it as such in emails which they though were private.
@Hammiesink
The reasoning goes like this:
1. If tree ring proxies are inaccurate, then the the MWP was warmer than today, and CO2 is just a weak component in the current warming
2. Tree ring proxies are inaccurate
3. Therefore, CO2 is not a *dangerous* greenhouse gas, and CO2limiting measures are not needed.
@Hammiesink
This business of lumping science skeptics with political buffoonery has got to stop. It’s a wonder you didn’t drag up the canard re skeptics being funded by evil oil companies.
The issue at hand is twofold — reliability of data and openness in the process. The data reliability is where the science skeptics discuss things. The lack of openness (e.g. refusal to respond to FOIA requests in a timely manner, if at all) is what fuels the politics junkies.
There has been fraud regarding funds on Climate Change research:
http://blogs.telegraph.co.uk/news/jamesdelingpole/100019956/climategate-the-lawyers-move-in-those-scientists-are-toast/
http://www.youtube.com/watch?v=Cu_ok37HDuE (ClimateGate Who’s Who)
http://www.youtube.com/watch?v=aUtzMBfDrpI (Armed Response to ‘Climategate’ question). This is how the UN censors questions about Global Warming.
and more fraud in the carbon trading scheme:
http://pajamasmedia.com/blog/climategate-european-carbon-credit-trading-system-plagued-by-fraud/
And now, the question everyone should ask: How much carbon reduction is needed to reduce the temperature to the UN target?
Answer: A minimum of 80 years without electricity and without fuel. That is, no heating, no cooking, no cars, no trucks, no tractors for agriculture, no cargo boats and no planes.
http://www.youtube.com/watch?v=WLKCyk_DhVI (Climate-Gate – Michael Coren with Lord Christopher Monckton )
Follow the money….
“The carbon market in the US is expected to be trillions of dollars by 2015, and the technology we are offering is as little as 10% to half of that number”. Earning only 10% of a trillion represents an income of 100 billions a year, which is twice the total wealth of Bill Gates. Guess who is behind this corporation, to become a trillionaire? You have to watch http://www.youtube.com/watch?v=HuifVNofEtk