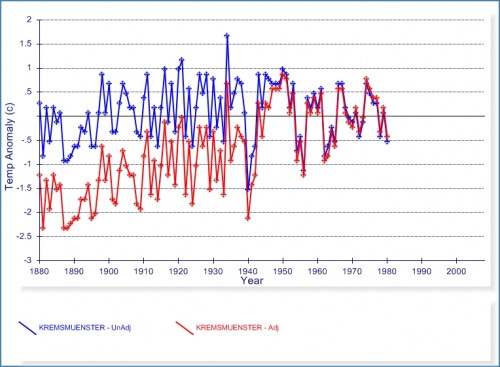
The American Thinker blog is running a daily series of charts showing raw and “value added” or adjusted station data. The amount of the global warming signal that comes from manual adjustments rather than actual measurements is something we have discussed here before, but you can see in each of their daily examples.
Unadjusted and adjusted temperatures at Kremsmuenster, Austria
Source: AppInSys (Applied Information Systems) using NOAA/GHCN database for Kremsmuenster, Austria
You can create the same charts for any station here.


OMG! It would appear that Global Cooling may be occurring in the past, retroactively! Does this mean we need to propose a massively costly and problematic centrally controlled program to increase CO2 emissions in the past? Huuuhhhmmm…..in order to avoid current ‘warming’ from seeming to occur?
This argues any surface station warming that was an artifact of increasing urbanization or location changes would even more exaggerate the ‘warming trend’ created by such “manual adjustment”, wouldn’t it?
Interesting. Do the records indicate any rationale for these adjustments, besides the implication of achieving ‘desired’ results?
I second ADiff.
Anyone got a cite on the “fact” that the UHI in Manhattan is supposed to have diminished in the last 100 years? I.e. the adjustments that are currently used, in effect, consider UHI to have been worse in NY before the enormous expansion of suburbs, cars, roads, A/C, and additional building.
Stan
It’s Climate Audit somewhere. Search for “negative UHI” or something like that.
Yet another demonstration of Orwellian efforts by the AGW promoters.
The left, personified by the BO-zo administration, has reached the point where Humpty Dumpty meets 1984.
On the basis of this data: http://www.appinsys.com/GlobalWarming/climgraph.aspx?pltparms=GHCNT100XJanDecI188020080600111AR61710727000x
Climate scientists have guessed that there is a warming trend? I mean, the grid in Europe is sparse as it is. But it also lacks station data when it comes to existing stations… So, the best grids are in the US and from this one continent one seems to extrapolate to all others?!
And I even reduced Year-skipping to 6 month or more available data Oo I mean, if you don’T have data of about half the year, you can’t really call this a confident guess OO And still most stations in Germany are sparse (some starting at 1950, others just showing a small period of about 30-40 years Oo).
Sceptics should take note.
Climate scientists have been able to cool the past.
Cooling the future can’t be any harder than that.
Having just spent 2 hours playing with this I’m a bit worried because everywhere that I’ve lived at has gotten colder. Could this be my fault?
Does anyone know if it is possible to freely obtain un-tampered with radiosonde data?
“Orwellian efforts”
Hunter stole this from me.
Gore’s going to have to do another movie.
In this one, he can show quaint island fishermen standing in their normal spots tossing their filmy little homemade fishing nets out in that totally awesome expanding-spinning-circle-thingie that I can never get a net to do, and then show the net landing well short of the water onto dry sand, and, as the camera comes back to focus on the fisherman’s sad, puzzled and hungry face, Gore can tell us about how Sudden Climate Stasis, with its fattie polar bears and non-rising ocean levels, will leave millions of people – no, billions – starving to death as their nets fail to reach water in toss after toss after toss.
Hello all,
it would be a nice ‘trick’ if someone has the time and inclination, to do a little station by station graph like this of each one. Then put them into 2 sets – one showing how the raw temps were higher, one showing how the raw temps were lower than adjusted (because some peeps say it all works out the same in the end with no real UHI or ‘adusted bias’.
I’ve seen the overall stats and to the lay peeps these are unreadable. But a simple 2 columns of records would be visable and suitable for an msm article to easily produce. I’m guessing of 3000 records it would have 2500+ in one column and around 500 in the other…heh!
In the sense that your efforts are a great example of Orwellian style behavior, yes.
In the sense that you apparently meant, that I had not noted the similarities between the AGW social movement and Ingsoc, until you may have used a similar term, you gotta be kidding.
cya, troll.