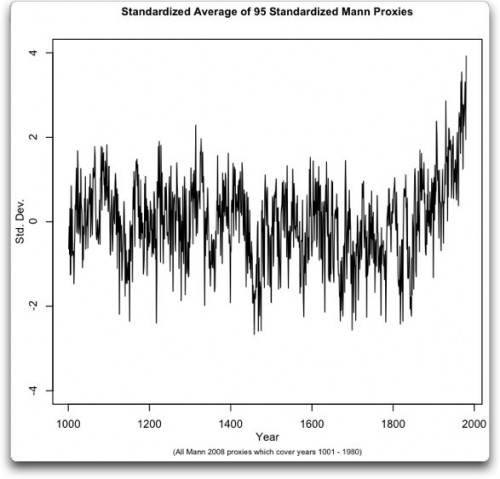
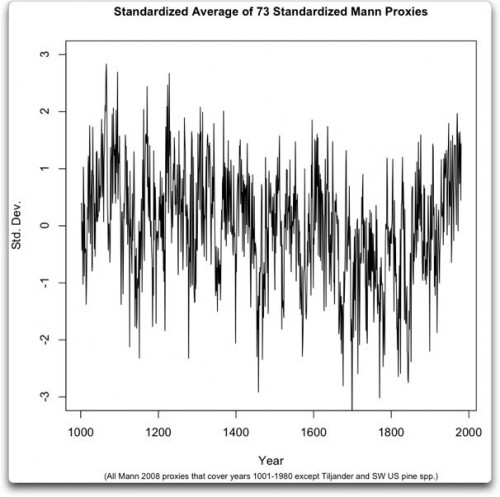
Will there ever be a time when sane people are not having to deconstruct yet another repackaging of Mann’s hockey stick, like some endless wack-a-mole game? Mann is back with a new hockey stick and, blow me away with surprise, it looks a heck of a lot like the old hockey stick:
Willis Eschenbach, writing at Climate Audit, outlines a new statistical approach he claims can help determine the signal-to-noise ratio in such a multi-proxy average, and in turn determine which proxies are contributing the most to the final outcome.
His approach and findings seem interesting, but I need to withhold judgment and let the statistical geeks tear it apart. I am always suspicious of algorithms that purport to sort or screen samples in or out of a sample set.
However, his climate-related finding can be accepted without necessarily agreeing with the methodology that got there. He claims his methodology shows that two sets of proxies — the Tiljander sediments and the Southwestern US Pines (mainly the bristlecones) — drive the hockey stick shape. This is reminiscent of Steve McIntyre’s finding years ago that just a few proxies in the original MBH 1999 drove most of the hockey stick form. Interestingly, these two series are the very ones that have received the most independent criticism for their methodology and ability to act as a proxy. In particular, the Tiljander Lake sediment data is out and out corrupted, and it is incredible that they could get past a peer review process (just reinforcing my feeling that peer review passes shoddy work that reinforces the professions prejudices and stands in the way of quality work by mavericks challenging the consensus).
Anyway, with these proxies removed, less than a quarter of the total, the hockey stick disappears.
Update: If you still have any confidence at all in climate scientists, I urge you to read this discussion of the Tiljander sediments. Mann managed to make two enormous mistakes. One, he used a series that the authors of the series very specifically caution has been disturbed and is not a valid proxy for the last 200-300 years. And two, he inverts the whole series! instead of showing it decreasing in the last 200 years (again due to corruption the authors warned about) he shows it upside down, increasing in the last 200 years, which then helps him build his hockey stick on absolutely false data.
One might argue that this is just the indictment of one scientist, but everyone in the profession seems to rally around and defend this one scientist, and the flaws listed above have been public for a while and absolutely no one seems interested in demanding Mann correct his numbers. In fact, most climate scientists spend their time shooting the messenger (Steve McIntyre).


“his climate-related finding can be accepted without necessarily agreeing with the methodology that got there”
Sorry, but that is completely anti-scientific. Never accept any result if you don’t agree with how it was derived, unless it’s been independently confirmed by a method you do agree with.
Jennifer,
Do you disagree that the Mann 2008 “hockey stick” is dependent on the Tiljander Lake sediment proxies?
Do you disagree with the creators of that proxy record when they warn that it is corrupted and not valid for the past 200-300 year?
Jennifer, I think his point is that you can test the conclusion independently. That is, the process says that Mann2008 is heavily dependent on Tiljander and Southwestern US Pines. You can remove them and average the results yourself without using the process. And that is exactly what the final graph shows. The process, which may be a modified PCA, highlighted the two sets of proxies. The graphs are simple averages of proxies and are unrelated to the process itself.
McIntyre’s blog doesn’t let me post comments. Perhaps he’s fed up with my song that AGW may have started off as merely inept science by fourth-rate physicists, but has become barefaced fraud.
“McIntyre’s blog doesn’t let me post comments. Perhaps he’s fed up with my song that AGW may have started off as merely inept science by fourth-rate physicists, but has become barefaced fraud”
I suspect he’s afraid of getting sued for defamation. Courts in Canada may very well be PC and whacky enough to entertain such a claim.
mkay: I am sure you are right – I haven’t read the climate audit post at all so can’t comment on its contents. But still it is seriously anti-scientific to believe someone’s results even if you don’t trust their methodology. In any case, the statement “with these proxies removed, less than a quarter of the total, the hockey stick disappears” is not supported by the data. The so-called hockey stick clearly remains. Assuming these units of standard deviation are linearly related to temperature, then both graphs show a long-term decline in temperature, followed by a rise starting in about 1800. The only difference is that either the current temperatures are unprecedented in the last 1000 years, or the last 500-700 years.
“The only difference is that either the current temperatures are unprecedented in the last 1000 years, or the last 500-700 years.”
Without the Tiljander proxies, we have to go back to the late 1500s. The statement “it has not been as warm as it is now since the late 1500s” is not at all controversial – even most “denialist” will readily admit the existence of the little ice age, and the warming since.
You pretend the changes that occur when removing the Tiljander proxies to be a minor result. The difference is about 2-3 std. dev. when comparing recent temperatures to the peak of the MWP. Do scientists in general consider 2-3 std. dev to be minor? You are the self-proclaimed expert on all things Scientific after all. Please, share your expert opinion.
In reply to dearieme and dreamin: I had problems after McIntyre switched
to a different server after his site was crashed several times. Try
the browser firefox at
http://www.mozilla.com/en-US/firefox/
and you’ll be able to get on
Jennifer- you are confused about the difference between accepting a method and accepting a conclusion.
I could say : take the equation 1666/6664, proceed to
cancel out sixes in both the numerator and denominator , and you’ll get
1666/6664 = 166/664= 16/64 = 1/4.
You will accept the result that all of the above fractions are equivalent
even though you disagree with my method of canceling out sixes.
– A. McIntire
So once again we see a combination of corrupted data, and algorithms designed to show the answers the the author wanted:
GISS, Hansen’s predictions, Mann’s recycled pap.
The thing that makes this sort of bogus work hold up, however, is the willful support of fellow AGW believers.
Alan. No, I am not confused. You are. I would accept your answer in the sum above because although your method is invalid, the answer can be verified by a valid method. Like I said in the first place, “Never accept any result if you don’t agree with how it was derived, unless it’s been independently confirmed by a method you do agree with.” The original post says nothing about independent confirmation – it just says “here is a statement, that has been arrived at by dodgy reasoning. But I like the statement, so I will endorse it.” This is anti-scientific.
@A. McIntire – thanks for the tip. The quality of his comments are often so high that I’ll lie low until I have something to contribute, rather than just something I want to get off my chest.
It is independently verified by removing the proxies found by the method and confirming that the end result is in fact very dependent on those proxies. Do you dispute this fact Jennifer?
Am I getting the silent treatment Jennifer? Poor me. I guess you will have to just let my words stand, unrefuted. You also continue to demonstrate your inability to answer simple questions. Ignore them or evade them – you are still quite incapable of answering direct questions that get straight to the heart of your arguments.
Perhaps I should just start posting under another name. No… no… I quite enjoy the silence.
No matter how much lipstick Mann paints on his hockey stick, it is still a pig.
That he is knowingly using corrupt data sets and trying to claim he is able divine meaningful data from it means that he already knows the answer he is after and simply wants to justify it.
If he actually was on to something, the stick would not disappear if knew proxy sources were used.
Instead, this is the climate equivalent of the ‘Faces on Mars’. That was where UFO crackpot Richard Hoagland (former NASA guy, by the way) spent decades telling people about how he was able to ‘prove’ there was a great pyramid complex on Mars. He were of course at best mistaken, and at worst simply a con-artist. Even after it is obvious the Martian istes in question are just eroded hills, there are still true believers who claim it is all a big coverup and that Hoagland is a great genius.
Mann is fixated on his hockey stick, because without the temp data is just a non-threatening pile. But by his magic, he transforms it, into an ominous indictment of humans. Selling the wickedness of humans and an impending apocalypse is much more fun- and as Gore & co. demonstrates, profitable.
Think how achievable it would have been to have spent the last years building a global standard to burn coal and diesel more cleanly, and to cut down on particulates aerosols and soot.
Instead, we are chasing the delusion of climate management by way of CO2. And the AGW promoters are attacking anyone who even dares talk about other claimte forcings, much less questioning their assertion that CO2 is the leading claimte forcing.
Meanwhile, we know the AGW community was wrong about the Arctic ice. They were wrong about temps. They were wrong about storm strength. They were wrong about droughts.
Yet Gore &co. cannot be questioned?
Bunk.
The exclusion of a single proxy series completely alters the shape of the reconstruction. This complete lack of robustness raises serious questions about the design goals of Mann’s approach.
Manfred:
“This complete lack of robustness raises serious questions about the design goals of Mann’s approach.”
Actually, it answers more questions than it raises.
All climate is local. Trying to define global climate trends based on Southwestern US Bristlecone Pine data is the same as conclusively determining a trend with one data point.