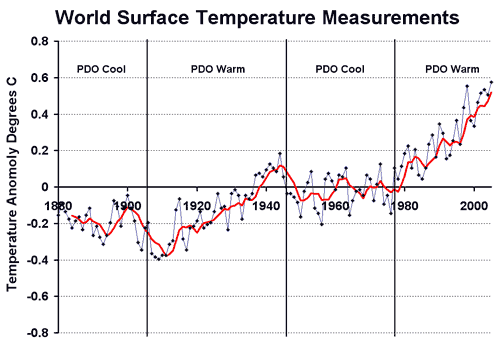
Since I am a bit late on this, you have probably already seen the stories from NASA that apparently the Pacific Decadal Occilation, which switches from warm to cool cycles every thirty to forty years, has just switched from warm to cool.
The Pacific Decadal Oscillation (PDO) is a temperature pattern in the Pacific Ocean that spends roughly 20-30 years in the cool phase or the warm phase.
In 1905, PDO switched to a warm phase.
In 1946, PDO switched to a cool phase.
In 1977, PDO switched to a warm phase.
In 1998, PDO showed a few cool years.The warm (cool) phase is determined by above-the-average (below-the-average) temperatures along the West Coast of the U.S. and Canada.
At the same time, a longer cycle occilation in the Atlantic called the AMO may also be in the cooling part of its occilation over the next decades.
Though from what I read, the PDO mainly affects temperatures around the Pacific Rim, the Pacific is in fact a very large part of the earth, so I wondered if its cylcling might have some correlation with world temperatures:
Well, that is kind of interesting. Note by the way I use the GISS surface data in this chart, so one can assume the warming in the last 20 years is overstated for a variety of reasons we have discussed on this site. Never-the-less, it is interesting. A few thoughts:
-
Catastrophists are spinning that the PDO cool cycles just delay or suppress man-made warming signals. OK. But if you argue this, you have to also argue for the converse — that the PDO exaggerate what might be man-made warming signals during its warm cycles. Catastrophists and in particular the IPCC, however, said that all of the post 1977 warming was due to man – I don’t remember anyone mentioning "PDO" in these discussions (In fact, they argue that some additional warming was being masked). Catastrophists love to point to natural cycles only when they can be claimed to mask man-made warming.
-
I am constantly amazed at how much the 1905-1947 trend on this chart looks like the 1977-2005 trend. But here is the amazing thing to me: Catastrophists as well as the IPCC claim that these trends had different causes. In fact, you MUST believe they had different causes to believe the AGW story (since there was little man-made CO2 in the first period). In other words, to belive the catastrophic man-made global warming theory, you have to believe some effect, presumably natural but never identified by the IPCC, drove temperatures through 1947 and then switched off, never to return, at the exact same moment that man began producing CO2 in earnest.
Update: It may be too early to tell if the PDO is doing a major or sort of minor shift, but the past frequency seems to indicate we will see a shift soon.

