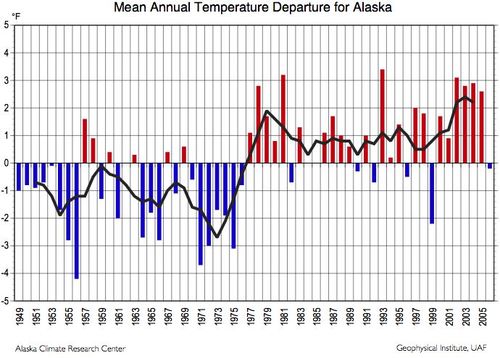
Stare deeply into this chart. What do you see?
What do you see:
- Strong evidence of anthropogenic global warming, or…
- The result of a long term climate cycle, in this case the shift of the Pacific Decadal Oscillation from its cold to warm phase, which occurred … wait for it … in 1976
This is why I entitled my first climate movie "What is Normal" [still available for free on YouTube!].


Pre-1976: We are all going to die from of Global Cooling.
Post-1976: We are all going to die from of Global Warming.
the really interesting thing with this chart is that absolutely all of the warming since 1949 came between 1975 and 1979. since then, nothing.
this chart lines up with remarkable precision to a chart of the phase of the current itself which can be seen here: http://jisao.washington.edu/pdo/
the current chart even lines up with he sudden cold spike in 2000.
it also seems to indicate that we are coming to the end of the current warm cycle. with luck, that may take some of the wind out of the AGW crowd’s sails.
hard to argue global warming when both poles are cooling…
Joe D’Aleo has got a great little tutorial on the PDO…
http://icecap.us/images/uploads/More_on_The_Great_Pacific_Climate_Shift_and_the_Relationship_of_Oceans_on_Global_Temperatures.pdf
The cooling from the 40’s to the 70’s? Negative PDO the whole time.
Really scary thought? PDO and the North Atlantic Oscillation going negative at the same time as the approaching solar minimum (AKA the Hansen Minimum.) Brrr.
Of course it’s the PDO, in the Northern hemisphere possibly amplified by a positive NAO for the past 50 years or so, but that won’t help us. You can’t use logic or obvious correlations when arguing with warmers, it has to be “proven” in climate models. The AGW believers will maintain that whatever the temperature does next there will always be an anthropogenic signal lurking in the background somewhere and, needless to say, this will continue to be the case until we stop burning fossil fuels and change to a socialist way of life.
While looking for something else, I ran across this–the water temperature in the Truckee River:
http://waterdata.usgs.gov/ca/nwis/dv/?dd_cd=03_00010_00001,03_00010_00002&format=img_default&site_no=10337500&set_logscale_y=0&begin_date=20070111
What (if anything) can be learned from long-term records of lake water temperatures and such?